# setting the region
g.region -p raster=elev_state_500m
# create Voronoi diagram based on meteorological stations
v.voronoi input=precip_30ynormals output=precip_annual
# List of attributes for the vector precip_annual
v.info -c precip_annual
# v.surf.mass converts attributes to density, but rainfall is
# typically measured in mm which is the same for all cells in the
# same input area, thus:
# new column for area size and adjusted precipitation
v.db.addcolumn map=precip_annual \
column="area double precision, prec_adj double precision"
v.to.db map=precip_annual column=area option=area units=meters
# Getting the size of the smallest area
v.db.univar precip_annual column=area
# The smallest area with some population is 1.20789e+08 square meters
# and with a resolution of 5000 meters covered by appr. four pixels
# (depending on the shape of the area). Adjust region for that:
g.region res=5000 -ap
# adjust precipitation values: multiply by area size, dived by pixel size
v.db.update map=precip_annual column=prec_adj \
qcolumn="annual * area / 25000000"
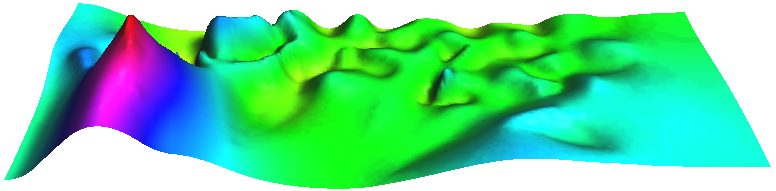
# mass-preserving area interpolation
v.surf.mass input=precip_annual output=precip_annual_pycno column=prec_adj iterations=200
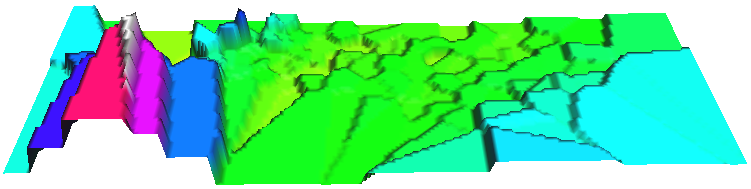
# rasterize Voronoi diagram for comparison
v.to.rast precip_annual out=precip_annual_voronoi type=area use=attr attrcolumn=annual
# verify results
d.mon wx0
d.rast.leg precip_annual_voronoi
d.rast.leg precip_annual_pycno