The GRASS Development Team and members of the user community have collected
numerous screenshots on these pages.
Cartography and journal quality figures are created using the specialist
ps.map hardcopy
authoring tool or directly from the main GIS displays using the
PostScript,
PNG, or Cairo drivers. Use of the hardcopy display drivers may be automated
with the d.out.file
module. In addition GRASS data
may be exported for use in other popular mapping software such as
GMT or
Quantum GIS.
Collaboration with external software is highly encouraged.
GRASS 6.4
GRASS 6.3
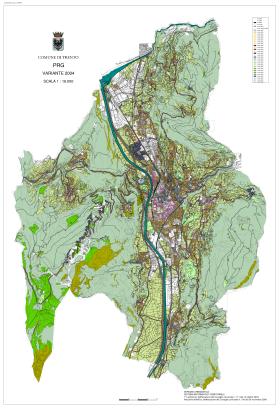
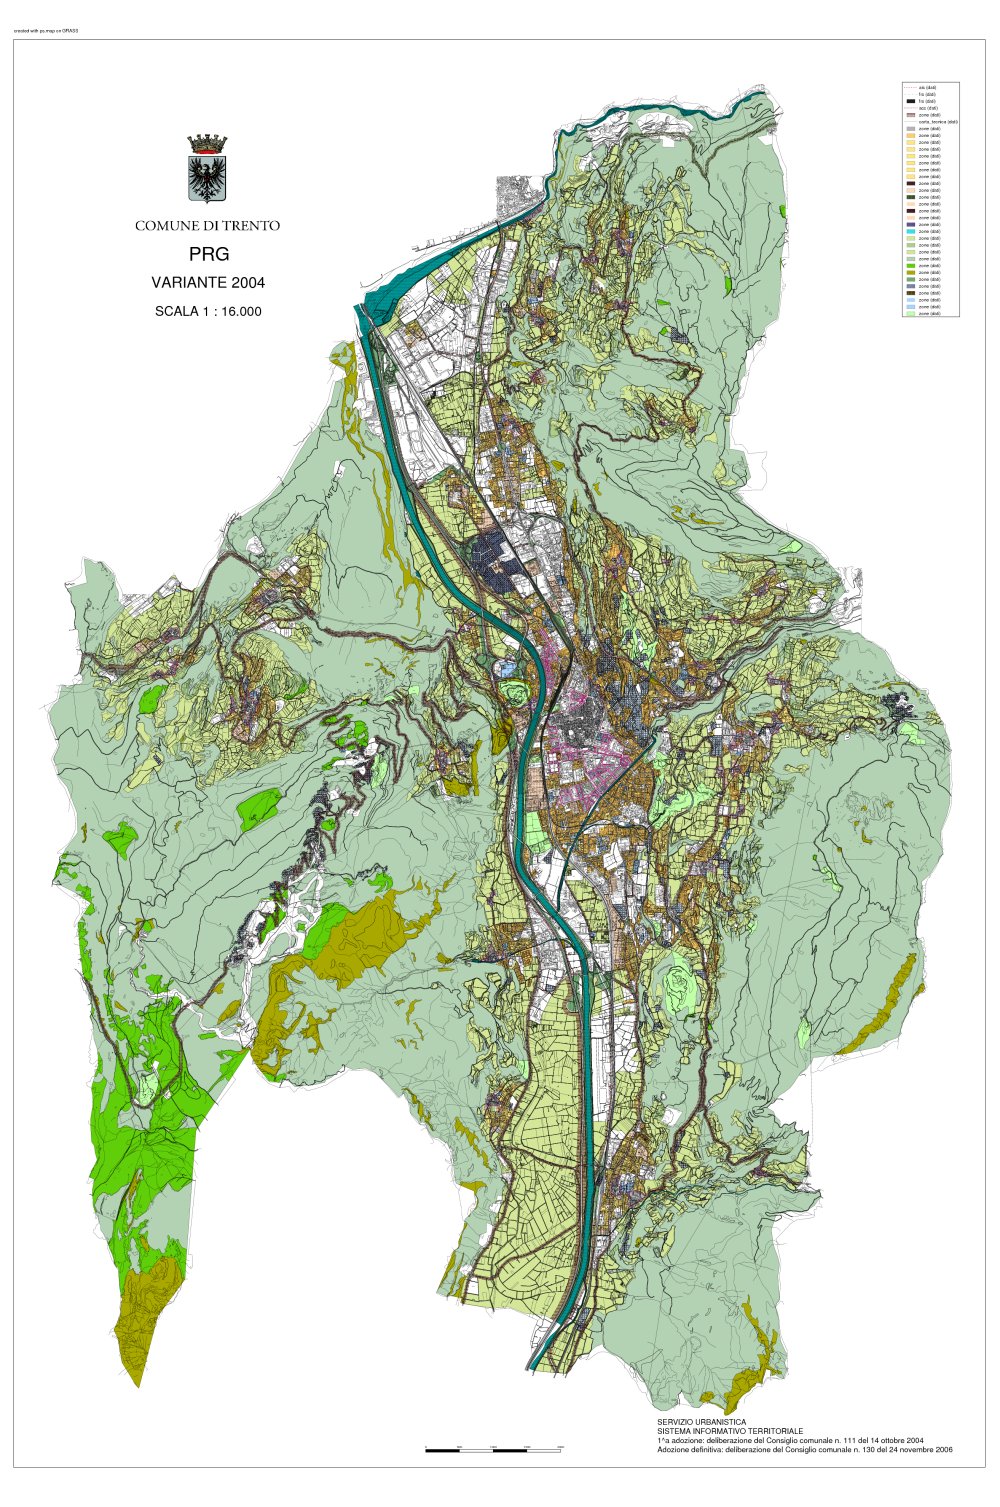
Comune di Trento - Piano Regolatore Generale
(PRG - master plan), Variante 2004
The map was generated with the ps.map tool.
Download the full size image (6MB)
(Courtesy: Comune di Trento)
|
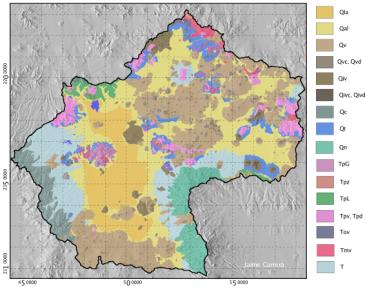
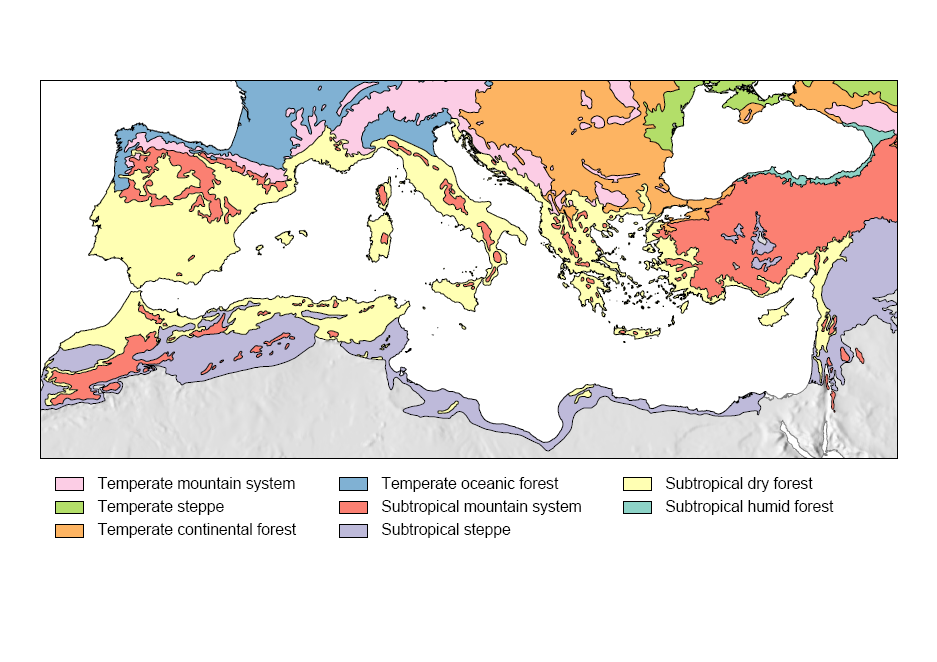
Geologic map of the Mexico Valley Basin
A collection of Free mapping software was used:
Map layers were prepared in GRASS and then exported to
GMT.
Final touchups done in
The GIMP and
Inkscape.
screenshot:
Jaime Carrera
|
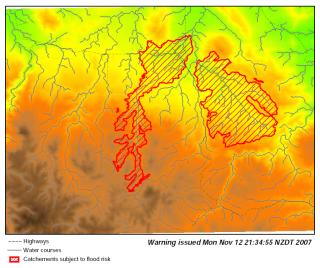
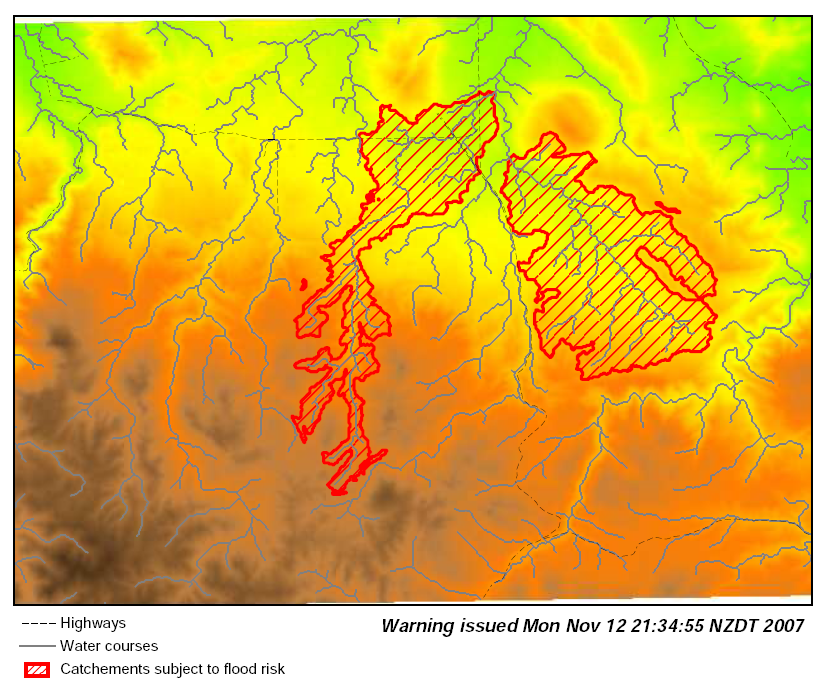
A hypothetical flood risk map for the Spearfish, SD sample dataset
generated on the fly with a
ps.map script
screenshot: H. Bowman
|
GRASS 5
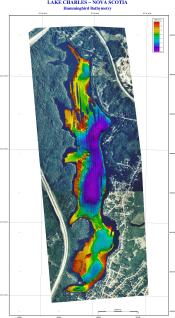
Multibeam image of Lake Charles, Nova Scotia
screenshot: Bob Covill - Tekmap Consulting
|
|
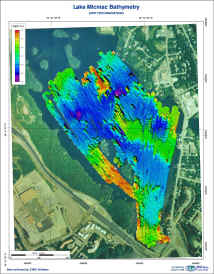
Multibeam image of Lake Micmac, Nova Scotia
screenshot: Bob Covill - Tekmap Consulting
|