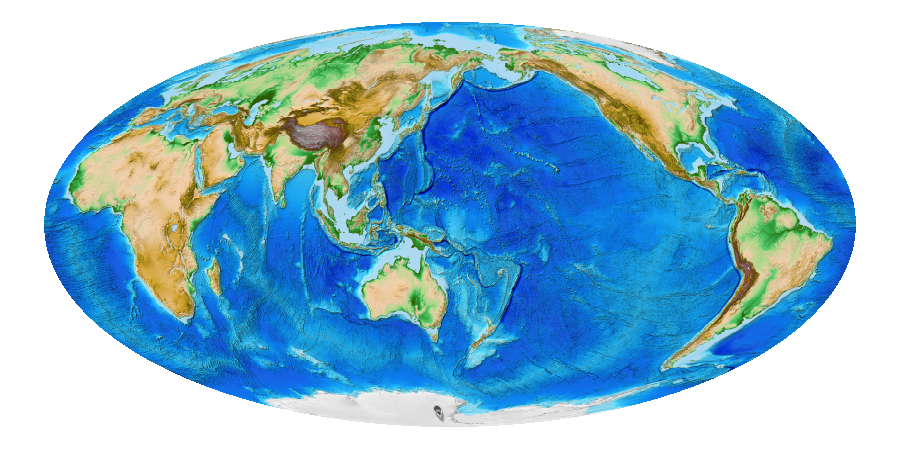
Mollweide projection of ETOPO1
screenshot: H. Bowman
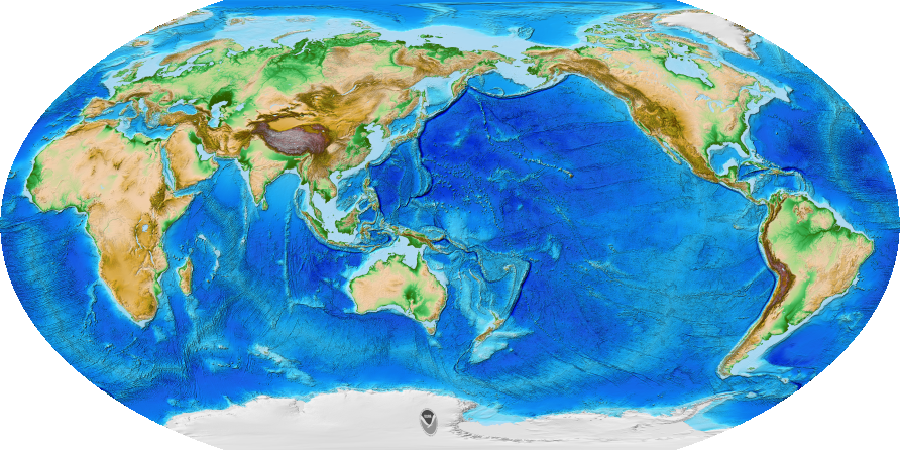
Winkel Tripel projection of ETOPO1
screenshot: H. Bowman
For details, see the raster map and 3D raster data (voxel) processing guides.
|
Mollweide projection of ETOPO1
|
Winkel Tripel projection of ETOPO1
|
  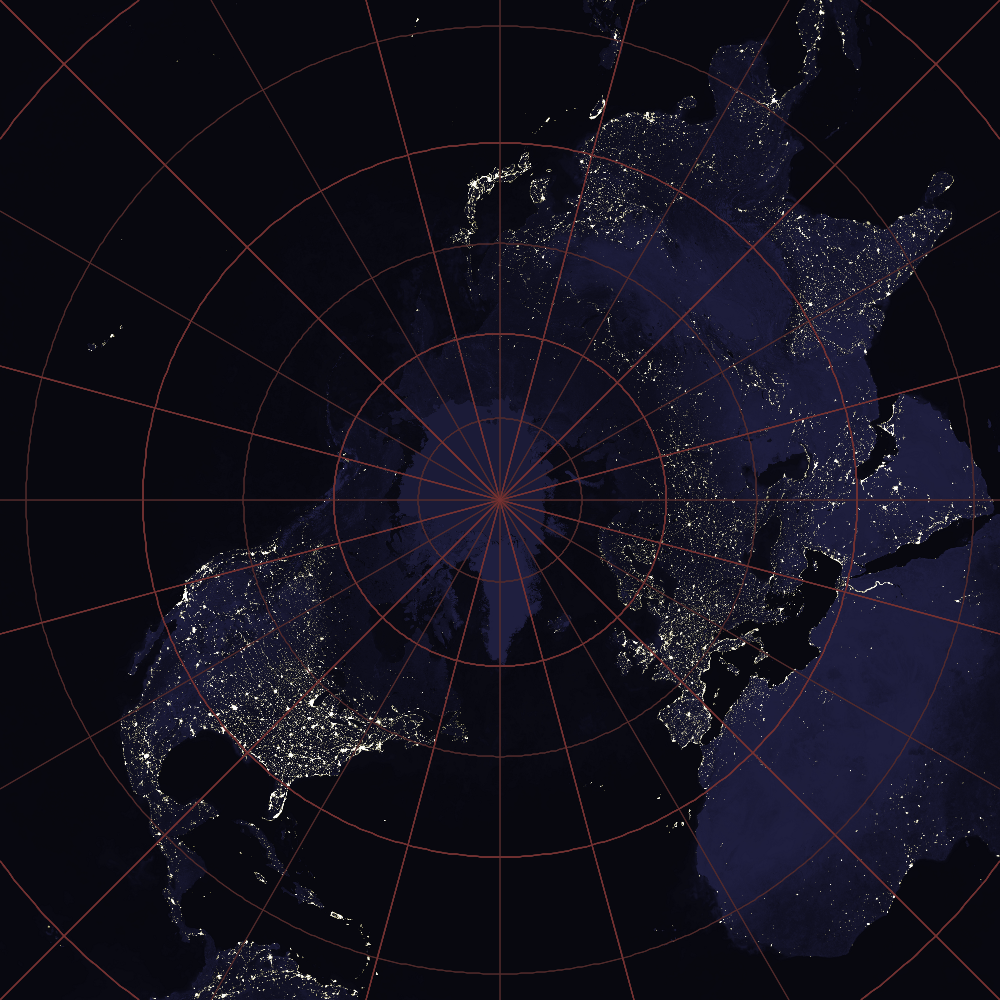 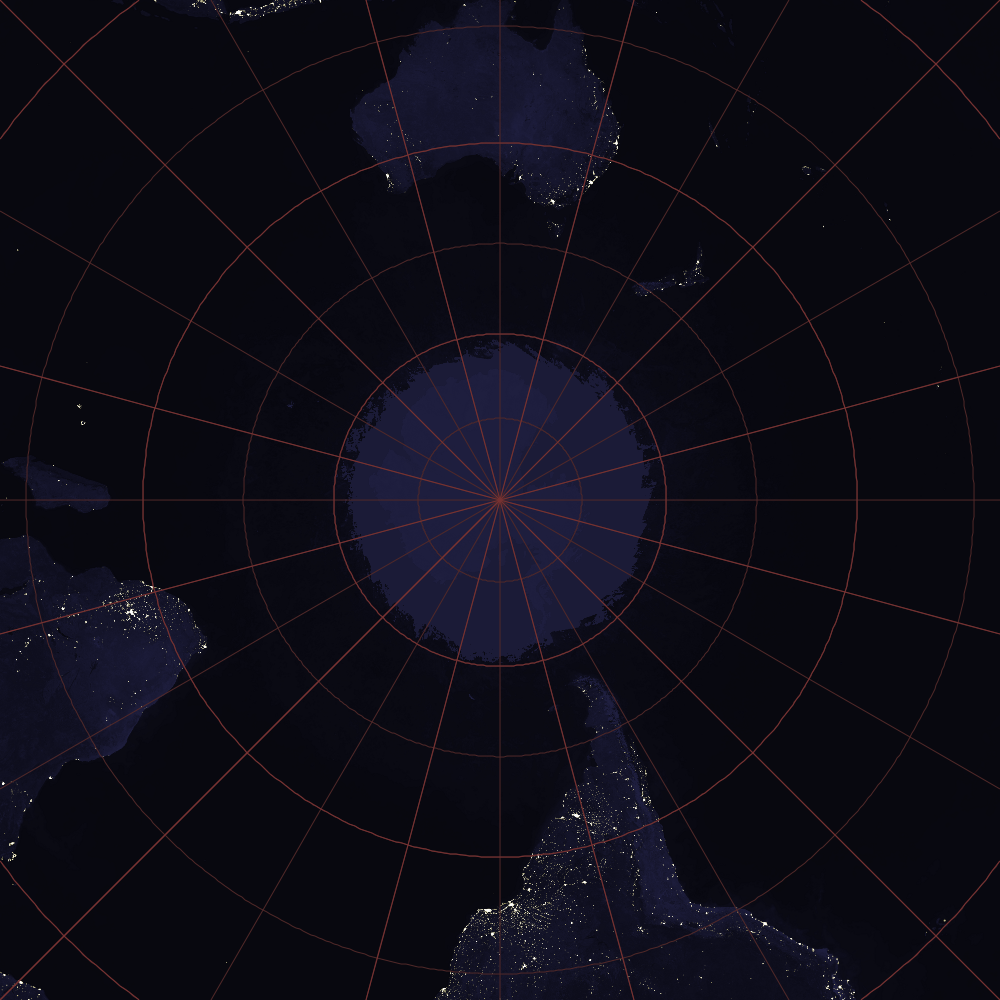
NASA's Blue Marble 2002 and Night on Earth (with ice)
|
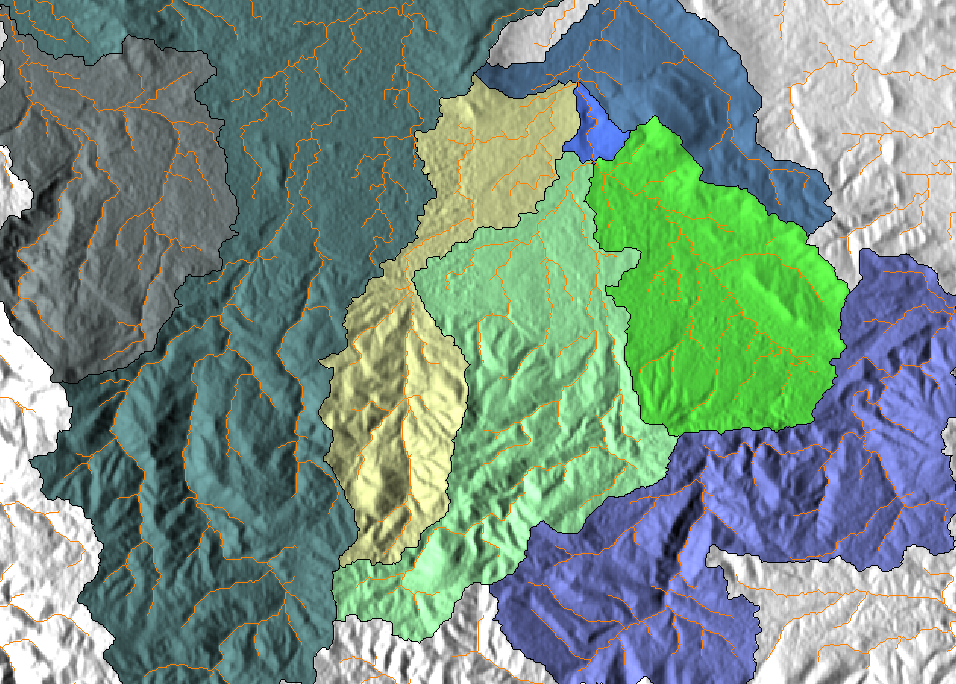
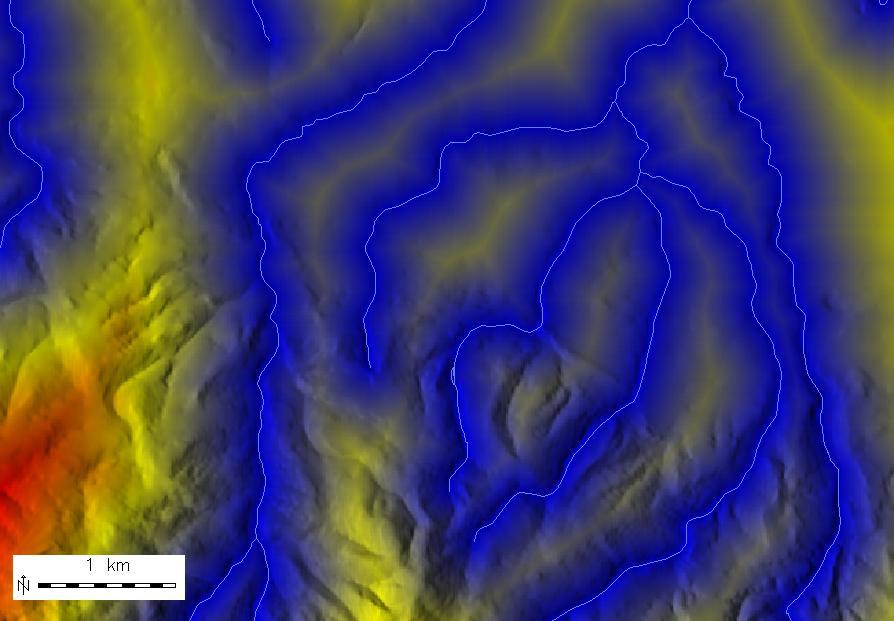
Catchment basins and water courses for Spearfish, South Dakota.
Generated using commands given in the
r.watershed help page
|
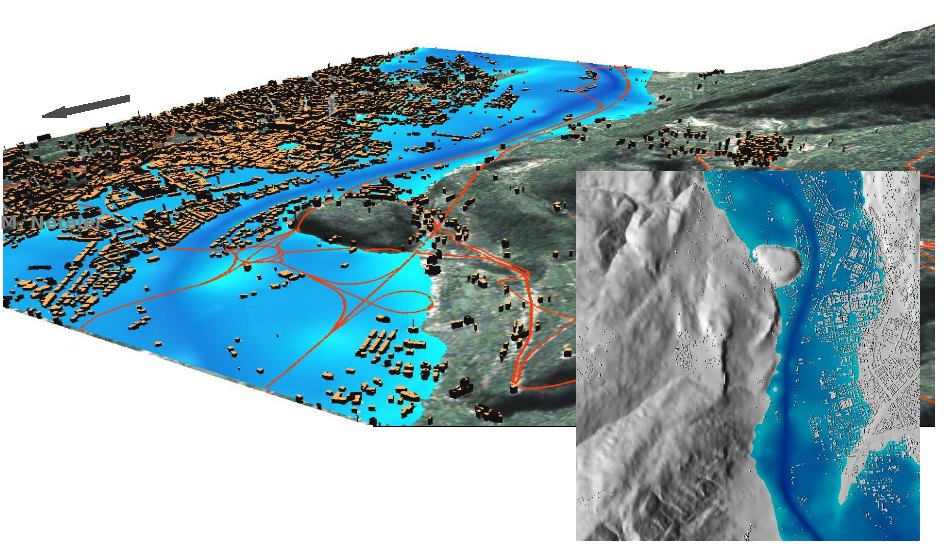
Flooding potential, taking into account the height of 3D buildings (Trento, Italy, simulation of 1966 event with r.lake)
|
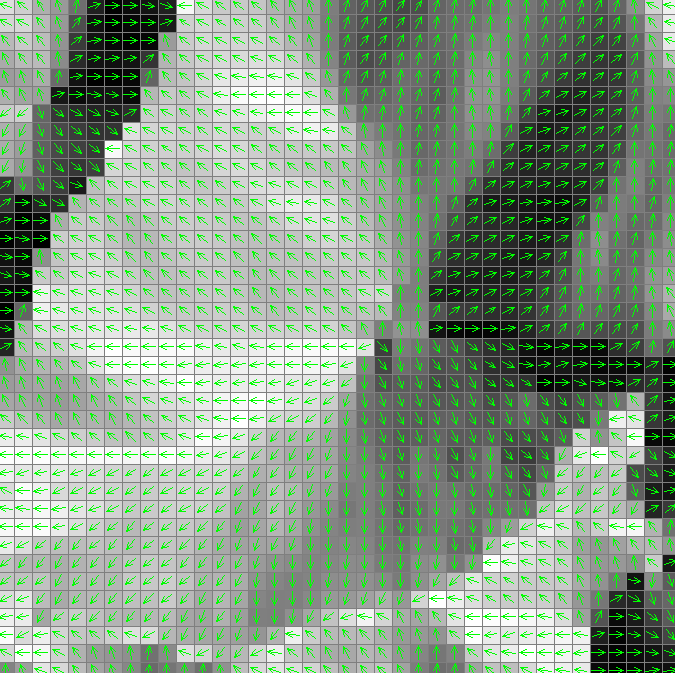
Flow or directional raster map
|
d.rast.arrow with dynamic arrow direction and size
|
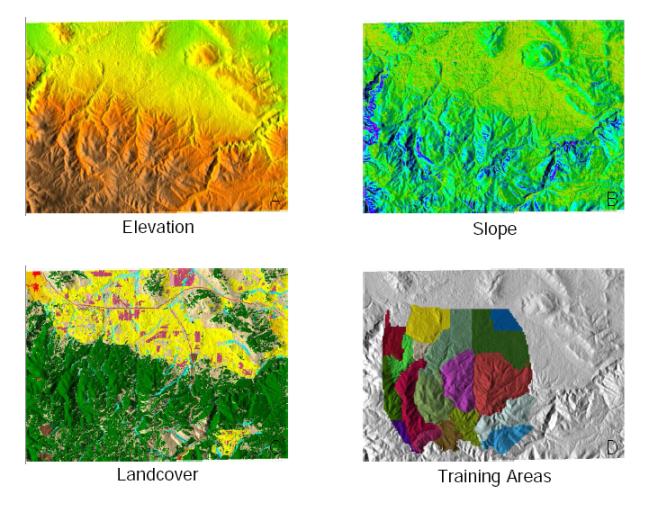
Elevation, slope, land cover, and training areas example for Spearfish, South Dakota.
Generated with ps.map using the commands found in
this script.
Commands to create a similar image with the display modules can be
found in the d.out.file help page.
|
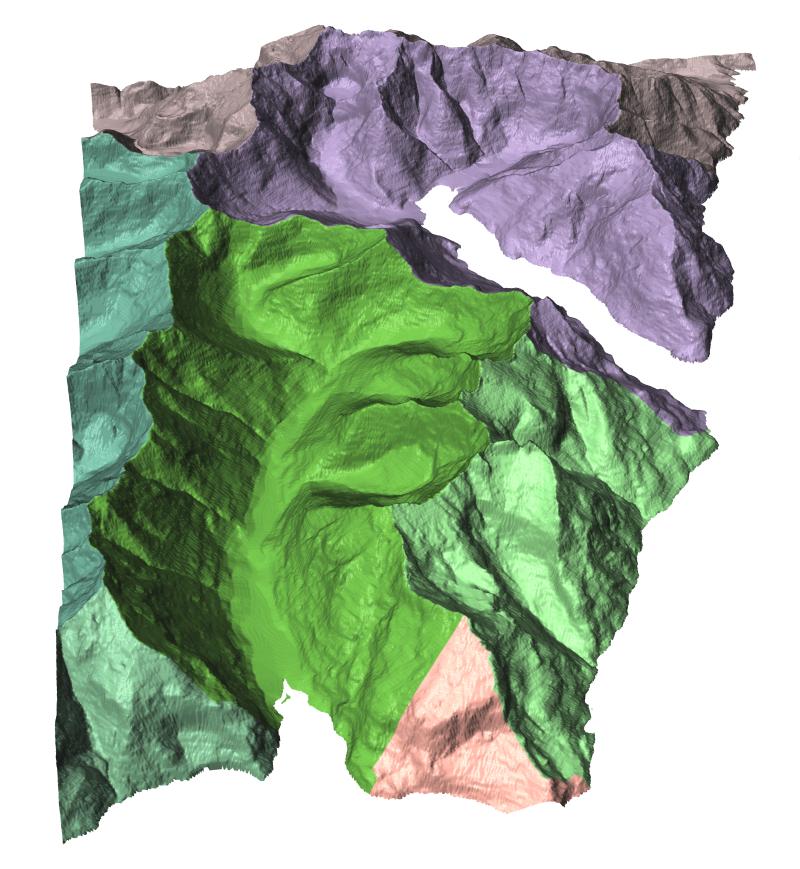
The Lucky Burn valley and First Arm catchment basins,
Doubtful Sound, Fiordland National Park, New Zealand.
Catchements generated with r.watershed and rendered using NVIZ
|
|
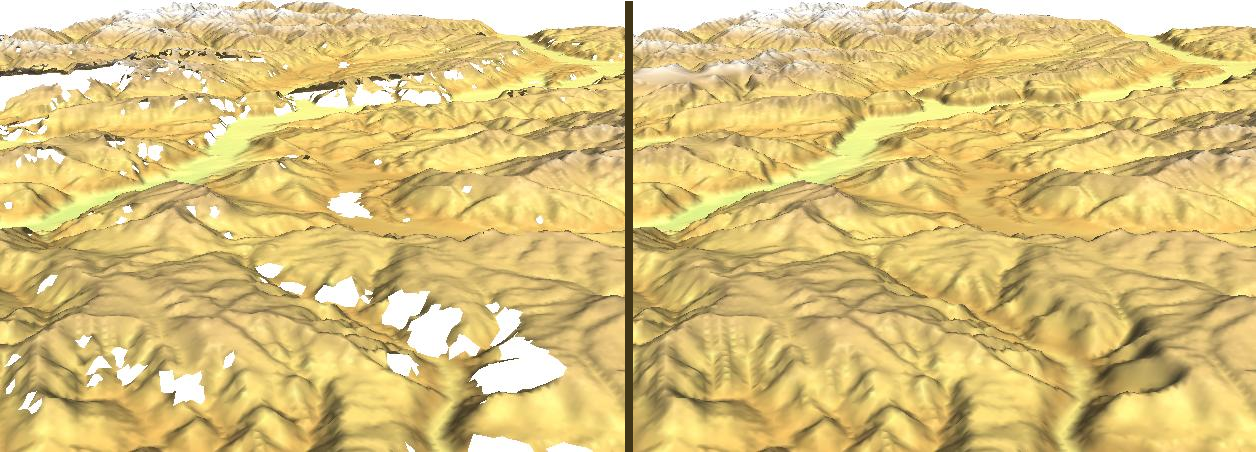
Void filling in SRTM DEM data with splines (r.fillnulls). See related article
in GRASS Newsletter #3, June 2005
Accumulated daily global radiation for 1 year at Trento (Italy)
without shadow and cloud correction (r.sun). The valleys are at
200-600m elevation while the mountains reach 2100m.
Accumulated daily global radiation for 1 year at Trento (Italy) with shadow correction (r.sun).
The valleys are at 200-600m elevation while the mountains reach 2100m.
This map is much closer to reality, optional cloud correction was not
applied. The color table is identical to above uncorrected map.
Visualization of SRTM V2 DEM used for above global radiation analysis
|
Lambert Equal Area projection of ETOPO2
|
Distance to water (r.cost)
|
|
|
|
No,
we're not kidding.
The GRASS theme song is awesome.
|
|