DESCRIPTION

r.wind.sun Evaluates visual impact (raster map) of aerogenerators and photovoltaic panels using a non dimensional impact factor.
The non dimensional index is calculated as the ratio of the area covered by windfarm and panels respect the area of Human Field of View.

I=Areaobj/Areafov

The distorsion effect is taken into account by considering distance and mutual heigth between object and observer. The distorted area of each single object is calculated and summed to evaluate the total field of view area occupied by the plants.
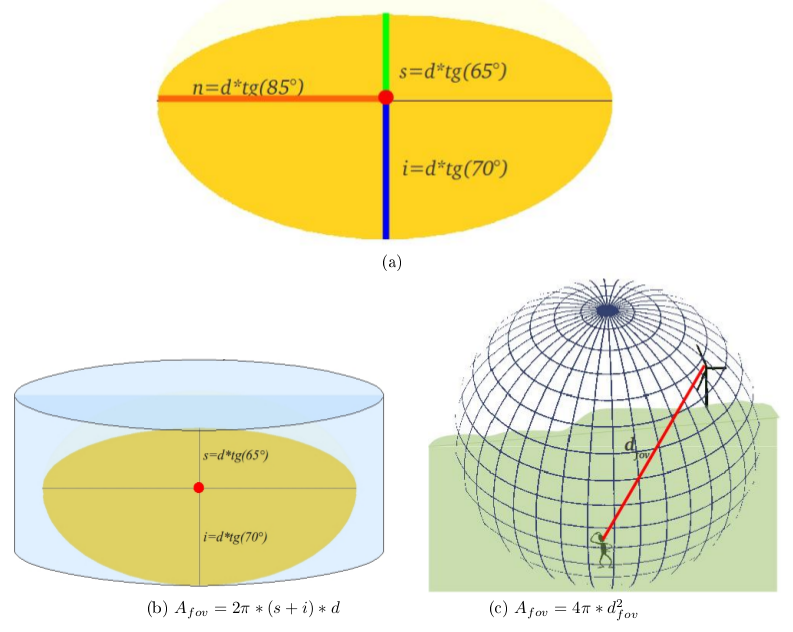
The static human field of view has an ellipsoidal (three axes) shape (fig. 1.a) and its area depends on the distance between observer and observed object (d).
In particular area is calculated as the internal area of a cylinder for panels because they are planar and horizontally placed object (fig. 1.b).
For aerogenerators a spherical field of view is evaluated (fig. 1.c).


Figure 1: the static, cilindric and spherical field of view.


For windfarm impact, the model takes in input a .dxf file with the 3D model of the aerogenerator. An example of the .dxf file can be downloaded here
This model is appropriately scaled and correctly placed on the terrain by defining inserting points. The windfarm is composed by all equal plants.
For panels the classical rectangular shape is considered and area is evaluated by specifying panels dimensions and inserting point.
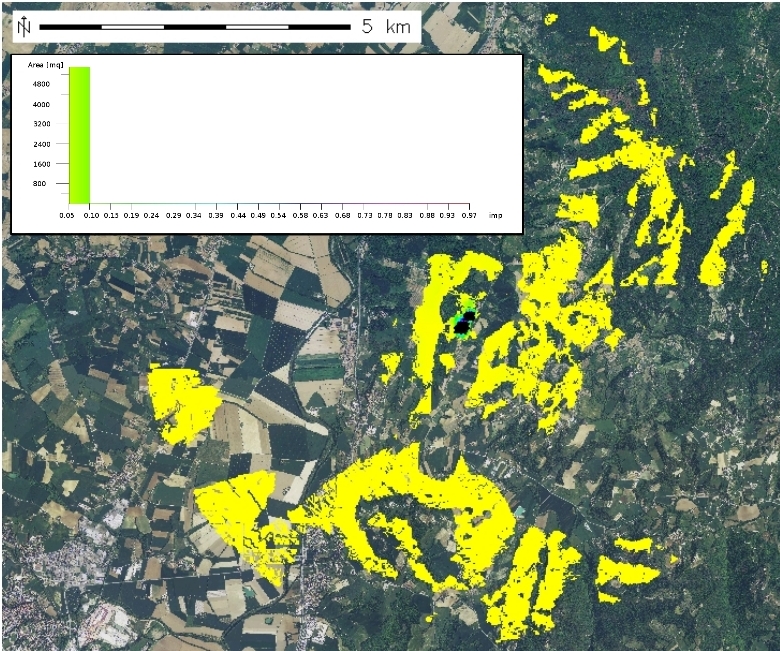
The output map is a raster with values of the impact index I (fig. 2).


Figure 1: the output impact map.


Most of the times the distribution of I values is logaritmic (the impact decreases more than linear with the increasing observation distance) so to better understand the results, it can be useful to reclassify the output map in classes of impact.

EXAMPLE

An example of the syntax for photovoltaic panels is reported below:
r.wind.sun -f dem=dem impact=visualImpact panels=placingPoints \
           panels_height=1.60 panels_width=0.9 angle=30 orient=180 \
           panels_center_height=1.52 resolution=20 min_dist_from_panel=5 \
           max_dist_from_panel=5000
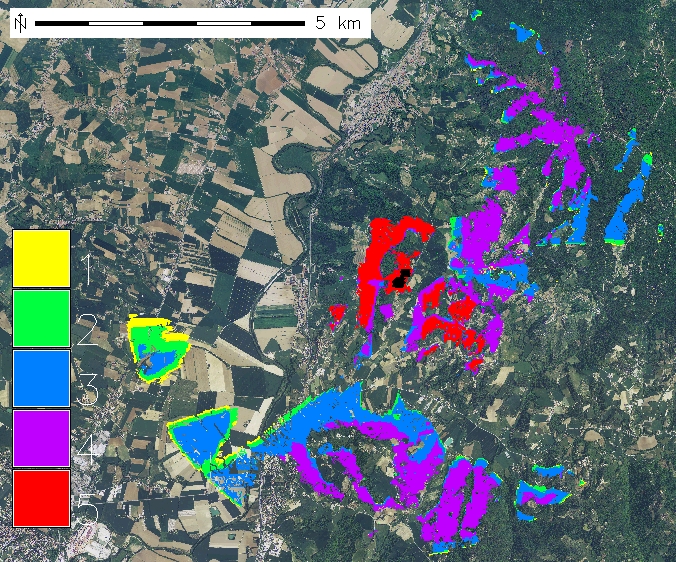
The output map logaritmically reclassified:

Figure 3: the output impact map reclassified.


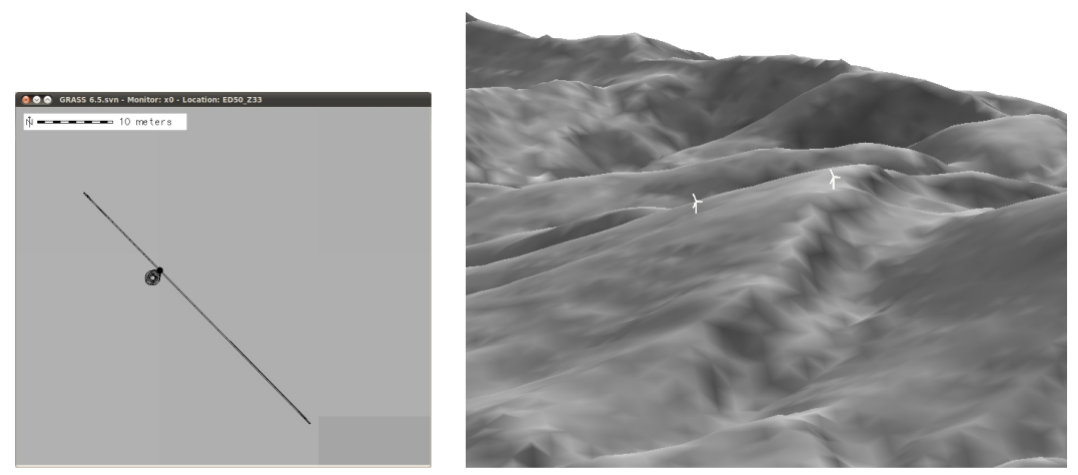
Other outputs are the 2D and 3D models of panels and arogenerators.
This models can be useful to produce 3D visualizations of the site.


Figure 3: an example of 2D and 3D models for aerogenerators (the 3D is visualized in NVIZ)


AUTHORS

Ivan Marchesini and Annalisa Minelli

Last changed: $Date$