DESCRIPTION

v.strahler calculates the Strahler Order for all lines of a given dendritic network. The input vector map must be free of cycles. For the elaboration a new imported network or a network extracted from DEM by using r.watershed can be used (in this case the topology has to be cleaned manually). More than one tree in the input data is allowed. No given flow direction is needed. To find the outlet of each tree, a DEM must be given. There are two additional scripts distributed with v.strahler:
- r.strahler.sh extracts streams from a DEM and call v.strahler on the result.
- r.broscoe.sh computes further statistical values for a given basin.

NOTES

Problems

This program is in beta status. It has the following shortcomings:
- The input data has to be topologically clean. Use sloppy=0.0
- Source code comments are not doxygenized (not a real problem).

How the algorithm works

In a first step, v.strahler identifies all separate networks in the input dataset. That means, all connected lines are assigned a common Basin ID.

Consequently, the lowest leaf of each tree is identified as outlet. An auxiliary DEM is needed at this point.

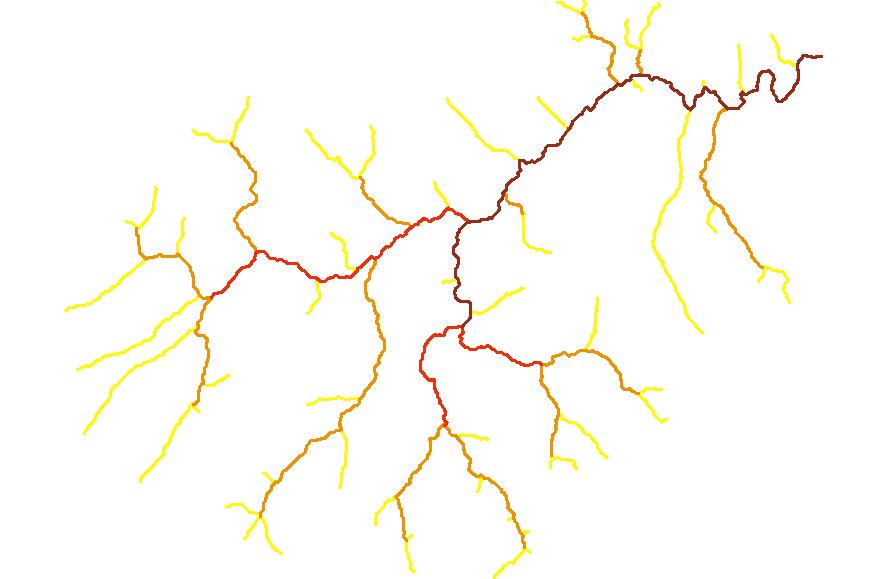
Strahler ordering begins at each leaf of the tree with order N=1 (excluding the outlet). At a confluence, the order N(r) of the resulting stream is equal to the highest order N(max) of the joining streams or is raised by one if there are two or more joining streams of order N(max).

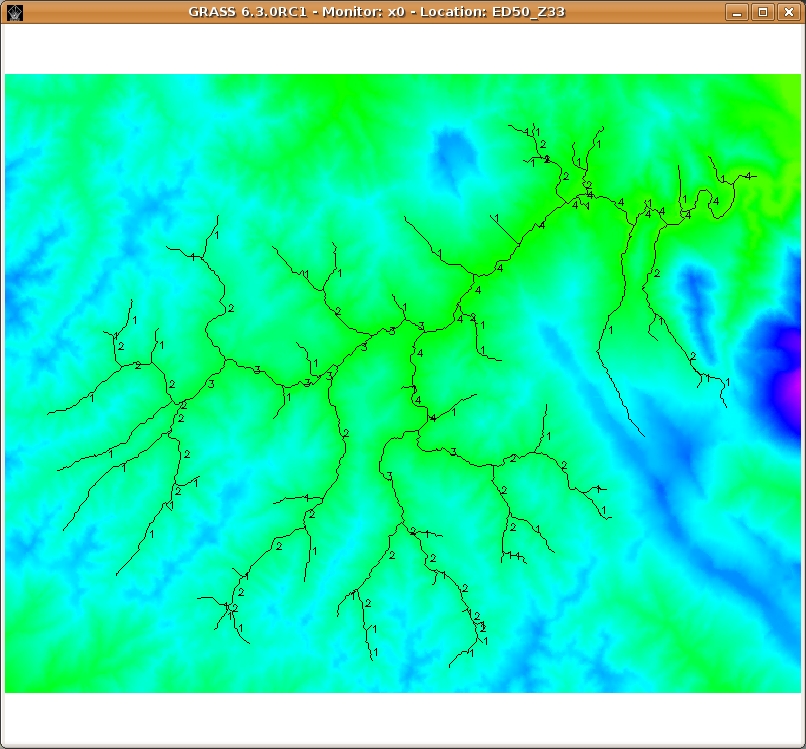
The algorithm returns an ASCII text file with columns: Category (from input map), Line (topology), Basin, Order; and the output map has the Strahler Order value instead of "category" for each line, and no connection with the database. See the also the diagrams in the documentation/ directory.

EXAMPLE

The input map (vector on DEM):

An example of the syntax in GRASS command line:

v.strahler input=esp_1@mapset output=esp_1 dem=dem_20@mapset \
          txout=/home/mapset/esp_1 sloppy=0 layer=1

An extract from the resultant text file:

== Result of Strahler Order ==
 Category:   Line:   Basin:    Order:
       22       1       1       4
       73       2       1       1
       25       3       1       4
       27       4       1       4
       39       5       1       1
       48       6       1       1
       56       7       1       4
       55       8       1       2
       88       9       1       4
       59      10       1       1
       60      11       1       1
       61      12       1       2
       83      13       1       2
       82      14       1       1
       91      15       1       1
       87      16       1       4
       95      17       1       2
       96      18       1       1
      106      19       1       1
      102      20       1       1
      104      21       1       4
      111      22       1       1
      112      23       1       3
      121      24       1       3
      126      25       1       1
      128      26       1       3
      137      27       1       3

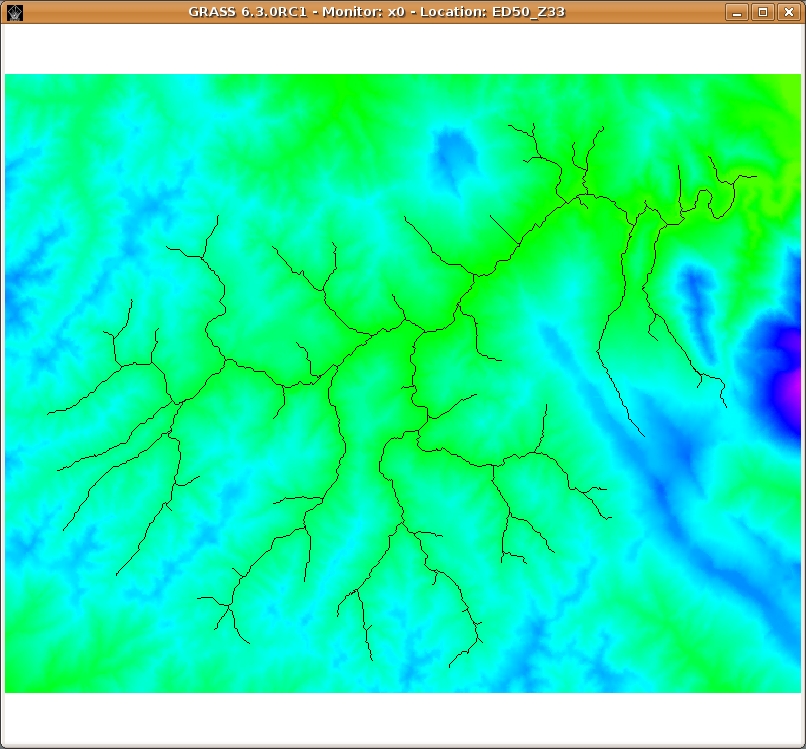
The output map (vector on DEM) form a snapshot of GRASS display:

The output map (vector only) from Qgis (different colors for different orders):

SEE ALSO

r.watershed

AUTHOR

Florian Kindl, Univ. Innsbruck.

Modified by: Ivan Marchesini and Annalisa Minelli, Univ. Perugia.

Last changed: $Date$