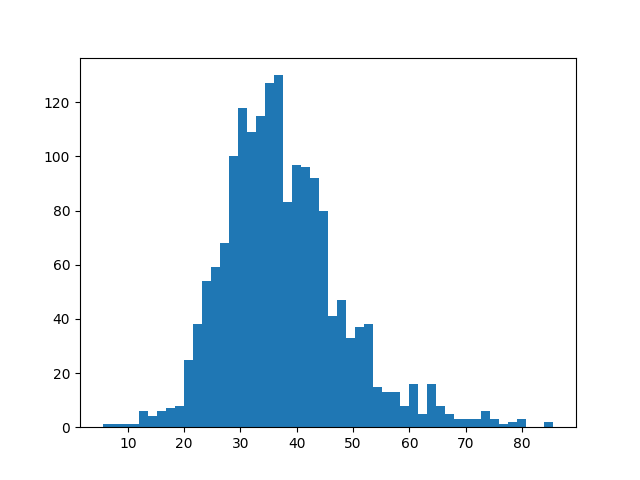
Histogram of median age values of census blocks
d.vect.colhist draws a histogram of the values in a vector map attribute column. The user use the where option to only select a subset of the attribute table and can determine the number of bins (bars) used for the histogram. The plot_output parameter determines whether the result is displayed on screen (default) or exported to a graphics file.
This is a quick and dirty solution using basic matplotlib. In future, this should be integrated into the g.gui, possibly together with the raster histogram tool.
d.vect.colhist map=censusblk_swwake column=MEDIAN_AGE where="TOTAL_POP>0"
Last changed: $Date$