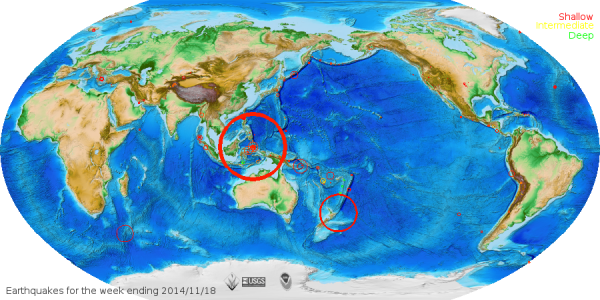
Example for earthquake map rendering (script code)
Thematic maps can be displayed by either a graduated color scheme (for all vector types), as graduated icon sizes (for point and centroid types), or graduated line widths (for lines and boundaries with associated attributes), see themetype option for details. The user selects the vector map to be mapped and attribute column from which to derive mapping intervals, and (optionally) the layer for attribute data.
In thematic maps, the color or point size changes for each range of attribute values. Value ranges for thematic mapping can be set at regular intervals, standard deviation units on either side of the mean, quartiles, or delimited by user-defined breakpoints, see themecalc option. User-defined breakpoints (themecalc=custom_breaks) can be entered via breakpoints option.
There is option colorscheme to define the color scheme (graduated colors) and range of point sizes (graduated points) for thematic maps.
Optionally, a simple text legend is printed when -l flag is given. A graphic legend can be drawn in the selected display monitor.
Thematic colors can be uploaded by rgb_column option to a specified attribute column (which is created automatically if doesn't exist in the table) for later display via d.vect and rgb_column option.
When the psmap option is set to 'name', two psmap instruction files are created (in the current directory if no path is given), one for the map ('name.psmap') and one for the legend ('name_legend.psmap'). The map file also contains 'label' commands which allow to create a legend directly in the map by adding a 'vlegend' command. See the ps.map manual page for more details.
The algorithm currently uses the v.univar to calculate basic descriptive statistics needed for thematic mapping (minimum, maximum, mean, standard deviation, and quartiles).
d.vect.thematic2 -l recent_earthquakes column=magnitude type=point
Earthquake points with different sizes:
d.vect.thematic2 -l recent_earthquakes column=magnitude type=point \
                themetype=graduated_points maxsize=15
North Carolina: differences between 'elevation' (10m) and 'elev_state_500m':
# random sampling of elevation points:
g.region raster=elevation -p
v.random random npoints=200
v.db.addtable random column="el10 double precision"
# transfer elevations to attribute table of random points map:
v.what.rast random rast=elevation column=el10
v.db.select random

# comparative sampling of second map, incl. differences:
v.sample input=random column=el10 raster=elev_state_500m output=elev_sample
v.db.select elev_sample

# univariate statistics:
v.univar -e elev_sample column=diff type=point

# thematic map:
d.mon wx0
d.vect.thematic2 -l elev_sample column=diff type=point
North Carolina sample dataset example:
g.region vector=nc_state
d.vect.thematic2 -l precip_30ynormals column=annual type=point
Various updates by:
Daniel Cavelo Aros,
Martin Landa,
Jachym Cepicky.
Last changed: $Date: 2008-08-15 08:16:42 +0200 (Fri, 15 Aug 2008)$