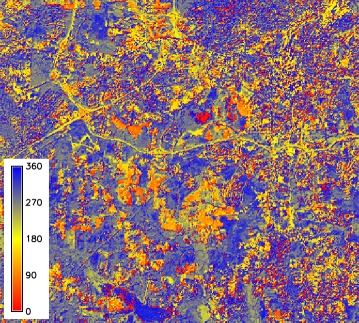
CVA angle map 1 |
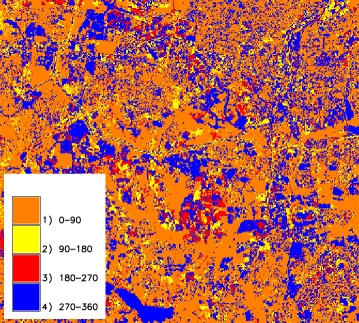
CVA classified angle map |
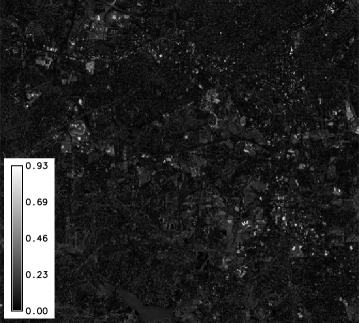
CVA magnitude map |
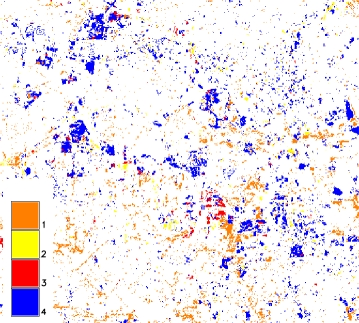
CVA change map |
Four parameters are required in input:
The following maps can be generated in output:
The change detection map is created using the classified angle map and applying
a threshold to the magnitude: the change is given by the pixels that have
values higher than the threshold, divided in four categories depending on
the quadrant they belong to.
The threshold can be chosen manually (custom value, given by personal
criteria) or using statistical criteria. In this case the mean of the magnitude
values is used and the user can choose the multiples of N standard
deviation to sum to the mean (threshold = mean + N * standard deviation).
One could consider of running the module at first without assigning a
threshold, in order to have an idea of the range of the magnitude and to
choose an appropriate custom threshold (for univariate statystical parameters
run r.univar). In this case i.cva gives
in output only three maps: the angle, angle classified and magnitude maps.
i.cva xaraster=lsat5_1987_tasscap.1 xbraster=lsat7_2002_tasscap.1 \
yaraster=lsat5_1987_tasscap.2 ybraster=lsat7_2002_tasscap.2 \
output=CVA_87_02 stat_threshold=1

Calculating DeltaX and DeltaY
Writing angle map CVA_87_02_angle
Writing magnitude map CVA_87_02_magnitude
Mean of magnitude values is: 0.091335330260002
Standard deviation of magnitude values is: 0.0671211630131731
Writing change detection map CVA_87_02_change
Threshold is 0.158456493273
|
CVA angle map 1 |
CVA classified angle map |
|
CVA magnitude map |
CVA change map |
Last changed: $Date: 2016-12-11 23:00:00 +0200 (Sun, 11 Dec 2016) $