DESCRIPTION
The r.colors.cubehelix module generates
a cubehelix color table and assigns it to given raster map
if requested.
The color table is generated using seaborn Python
package. Several pararameters are available to control the
cubehelix.
When option map is specified r.colors.cubehelix
assigns the color rules to the given raster map.
The color tables is always stratched based on the range of values of the map
Depending on the use case,
it may be advantageous to use the -d to discretize
the color table into intervals.
NOTES
This module depends on
seaborn
which needs to be installed on your computer.
Use your Python package manager (e.g. pip) or distribution package
manager to install it.
EXAMPLES
Creating a color table as GRASS color rules
We do 0.6 rotation around the axis and use discrete (interval) color table
rather than the standard continuous.
If we don't specify output file, it is printed to standard output:
r.colors.cubehelix -d ncolors=5 nrotations=0.6
0.000% 218:222:192
20.000% 218:222:192
20.000% 198:166:136
40.000% 198:166:136
40.000% 173:108:112
60.000% 173:108:112
60.000% 119:61:98
80.000% 119:61:98
80.000% 48:28:59
100.000% 48:28:59
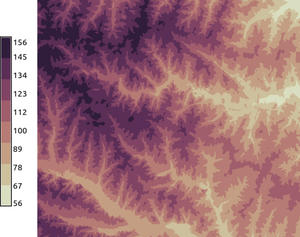
Setting color table for a raster map
Now we set several different color tables for the elevation raster map
from the North Carolina sample dataset.
We use continuous and discrete color tables (gradients).
The color tables ae stretched to fit the raster map range.
r.colors.cubehelix -d ncolors=8 nrotations=0.6 map=elevation
d.legend raster=elevation labelnum=10 at=5,50,7,10
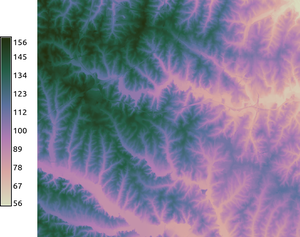
r.colors.cubehelix nrotations=1.4 start=4 map=elevation
Setting color table for a vector map
First we create a text file with color rules:
r.colors.cubehelix -i rot=0.6 output=cubehelix.txt
v.colors map=points rules=cubehelix.txt
REFERENCES
SEE ALSO
r.colors,
v.colors,
r3.colors,
r.cpt2grass,
r.colors.matplotlib
seaborn
cubehelix_palette
function documentation and an
example
AUTHOR
Vaclav Petras, NCSU OSGeoREL
Last changed: $Date$