DESCRIPTION

r.green.hydro.optimal detects the position of the potential hydropower plants that can produce the highest possible power. Deciding the range of plant length and the distance between plants, the module returns two vector maps with the segments of rivers exploited by the potential plants and with the intakes and restitution of these plants. The module computes the potential plants in order to maximize the power that can be produced.

NOTES

The three input files are the rivers considered (vector), the discharge for each point of this river (raster) and the elevation raster map to calculate the gross head.

The power is defined as:
P=η * ρ * g * Q * Δh
where η is the efficiency of the plant
ρ the density of water (1000 kg/m3)
g the gravity term (9,81 m/s2)
Q the discharge of the river
Δh the gross head of the considered segment

The module maximizes the power over a given range by a brute-force search in order to examine all possible arrangements of Q and Δh. Thus, the potential segments can be shorter than the maximum plant length chosen because it depends on the maximization of the product Q * Δh.

For each potential segment, the potential power is given in kW in attribute.

EXAMPLE

This example is based on the case-study of Gesso and Vermenagna valleys in the Natural Park of the Maritime Alps, Piedmont, Italy.

Here is the vector file availablestreams of the interested streams in which we want to compute the potential hydropower plants. The river segments already exploited by an existing plant do not appear in the file.
availablestreams
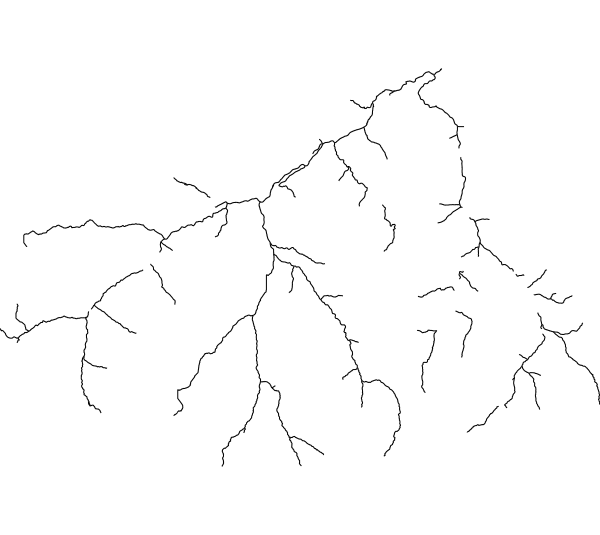
Input vector map availablestreams

The following command computes the potential plants for a plant length range from 10 to 800 m and a distance between plants of 800 m :

r.green.hydro.optimal 
discharge=discharge 
river=availablestreams 
elevation=elevation 
len_plant=800 
distance=800 
output_plant=potentialsegments 
output_point=potentialpoints
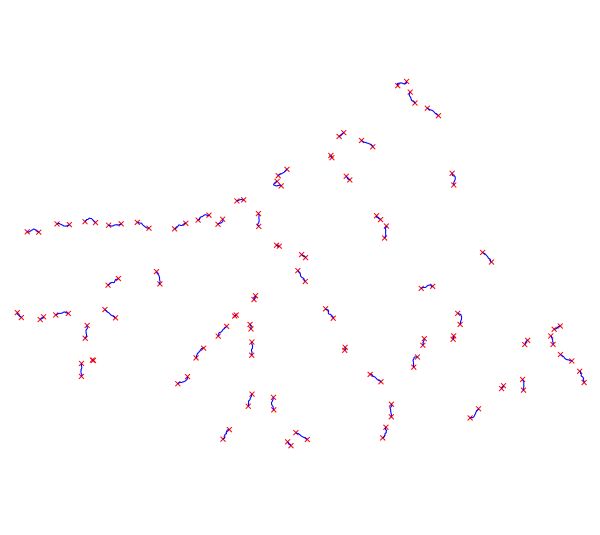
d.vect map= potentialpoints color=red
d.vect map= potentialplants color=blue

The output vector maps are shown in the following picture which gathers the potential segments vector map (potentialplants, in blue) and the potential intakes and restitution vector map (potentialpoints, in red)
potentialplants
Output vector maps potentialplants (in blue) and potentialpoints (in red)

SEE ALSO

r.green.hydro.discharge
r.green.hydro.delplants
r.green.hydro.theoretical
r.green.hydro.recommended
r.green.hydro.structure
r.green.hydro.technical
r.green.hydro.financial

AUTHORS

Giulia Garegnani (Eurac Research, Bolzano, Italy), Manual written by Julie Gros.
Last changed: $Date : 2015-07-08 10:57 GMT+1$