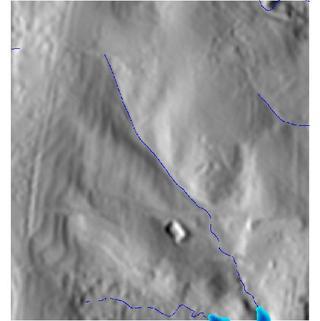
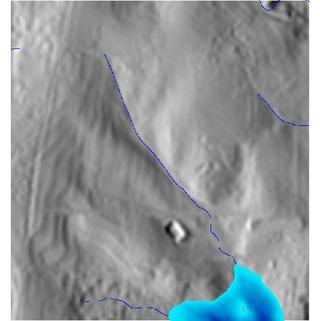
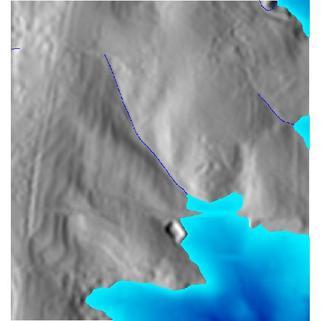
Figure: A bigger flooding in rural area of North Carolina sample dataset with water level at 105, 108 and 114 meters (water depth differs in different areas).
This module outputs:
# using unix-like shell syntax

# set computational region
g.region raster=elev_lid792_1m
# prepare input data
v.to.rast -d input=streams output=rural_streams use=val val=1

# compute a flooding scenario
r.lake.series elevation=elev_lid792_1m seed=rural_streams \
              start_wl=104.0 end_wl=115.0 wl_step=0.2 output=flooding

# visualize the flooding space-time raster dataset
g.gui.animation strds=flooding

# alternatively explore maps from dataset
# prepare shaded relief map
r.relief input=elev_lid792_1m output=elev_lid792_1m_shade
# set color table for streams
r.colors map=rural_streams rules=- <<EOF
1 blue
EOF

# open d.mon or map display
d.mon wx1

# show base maps
d.rast elev_lid792_1m_shade
d.rast rural_streams

# show particular flooding maps
d.rast flooding_105.0
d.rast flooding_108.0
d.rast flooding_114.0
Figure: A bigger flooding in rural area of North Carolina sample dataset with water level at 105, 108 and 114 meters (water depth differs in different areas).
Last changed: $Date$