DESCRIPTION
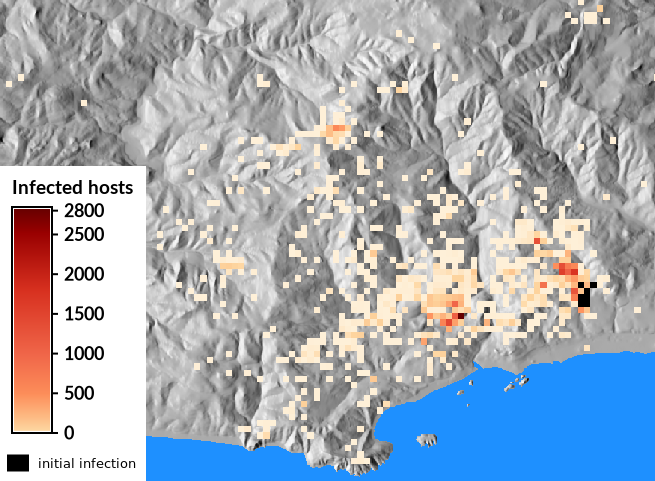
Module r.pops.spread
is a dynamic species distribution model for pest or pathogen spread in forest
or agricultural ecosystems. The model is process based
meaning that it uses understanding of the effect of weather on reproduction
and survival of the pest/pathogen in order to simulate
spread of the pest/pathogen into the future.
Module r.pops.spread is using
Pest or Pathogen Spread library.
 Figure: Logo of Pest or Pathogen Spread simulation
NOTES
-
The directions of wind consider north (N) to be grid north, if your
true north is different direction, you need to make an adjustment.
-
The module currently does not handle NULL (no data) as input, so you
need to change the NULLs to (most likely) zeros, for example:
r.null map=infection null=0.
EXAMPLES
Obtaining list of rasters
Use
R script to create weather coefficients based on a defined polynomial.
Example of creating file with list of input maps (unix-like command
line):
g.list type=raster pattern="moisture_*" mapset=climate -m > moistures.txt
g.list type=raster pattern="temperature_*" mapset=climate -m > temperatures.txt
g.list type=raster pattern="temperature_*" mapset=climate | sort -k2 -t_ -n > temperatures.txt
Generating a constant coefficient
In case the moisture coefficient is not used, we can generate a constant
raster map to be used as the coefficient:
Then using unix-like command line, we can create a list of these rasters
in a file based on the number of lines in a temperature list files we
created earlier:
NUM_LINES=`cat temperatures.txt | wc -l`
echo const_1 > moistures.txt
for LINE in `seq 2 $NUM_LINES`; do echo const_1 >> moistures.txt; done;
Creating treatments
To account for (vector) treatments partially covering host cells:
# set resolution for treatments and convert to raster
g.region res=10 -ap
v.to.rast input=treatment output=treatment use=val

# resample to lower resolution (match host map resolution)
g.region align=host_map -p
r.resamp.stats -w input=treatment output=treatment_resampled method=count
# get maximum value, which is dependent on resolution
# e.g. when resampling from 10m to 100m, max will be 100 (100 small cells in 1 big cell)
r.info -r treatment_resampled
# result will be 0 to 1
r.mapcalc "treatment_float = test_treatment_resampled / 100"
# adjust host layer
r.mapcalc "treated_host = host - host * treatment_float"
Running the model
Example of the run of the model (unix-like command line):
r.spread.pest host=host total_plants=all infected=infected_2005 \
    moisture_coefficient_file=moistures.txt temperature_coefficient_file=temperatures.txt \
    output=spread step=week start_time=2005 end_time=2010 \
    reproductive_rate=4 dispersal_kernel=cauchy wind=NE random_seed=4
REFERENCES
-
Ross K. Meentemeyer, Nik J. Cunniffe, Alex R. Cook,
Joao A. N. Filipe, Richard D. Hunter, David M. Rizzo,
and Christopher A. Gilligan 2011.
Epidemiological modeling of invasion in heterogeneous landscapes:
spread of sudden oak death in California (1990-2030).
Ecosphere 2:art17.
DOI: 10.1890/ES10-00192.1
-
Tonini, Francesco, Douglas Shoemaker, Anna Petrasova, Brendan Harmon,
Vaclav Petras, Richard C. Cobb, Helena Mitasova,
and Ross K. Meentemeyer.
Tangible geospatial modeling for collaborative solutions
to invasive species management.
Environmental Modelling & Software 92 (2017): 176-188.
DOI: 10.1016/j.envsoft.2017.02.020
SEE ALSO
r.pops.spread on GitHub
r.spread
AUTHORS
Francesco Tonini* (original R version)
Zexi Chen* (C++ version)
Vaclav Petras* (parallelization, GRASS interface)
Anna Petrasova* (single species simulation)
* Center for Geospatial Analytics, NCSU