-c: Find optimal parameters of used filter. The function to optimize depends on difference between original and filtered signals and on derivates of the filtered signal.
-u: Filter using upper boundary of the signal values (Useful for vegetation indexes filtering).
input: Raster names of equally spaced time series X.
result_prefix: Prefix for raster names of filterd X.
method: Filtering method. Implemented filters are Savitzky-Golay filter savgol and median filter median.
winsize: The length of the filter window. winsize must be a positive odd integer.
order: The order of the polynomial used to fit the samples. The order must be less than winsize (Savitzky-Golay only).
iterations: Number of filtering iterations.
opt_points: If -c is specifed, then random sample opt_points and use them in parameter optimization.
diff_penalty: Penalty for difference between original and filtered signals (see Notes).
deriv_penalty: Penalty for derivates of filtered signal (see Notes).
There is a procedure for searching for good filtering parameters: it uses opt_points random points and perfoms filtering in that points. The result of the filtering can be tested for quality. The quality function is a trade of two features: accuracy and smoothing. Accuracy can be estimated as the (abs) difference between original and filtered data, quality of smoothing can be estimated as absalute values of the derivates. So there are two parameters diff_penalty and deriv_penalty that can ajust the trade-of.
So the optimizing procedure performs loop over filtering parameters and calculates the next penalty function:
penalty = diff_penalty * sum(abs(Xi-Fi)) + sum(abs(dFi))
The optimal parameters are used for signal filtering in the whole region.
If -u flag is specifed, then filter uses Chen's algorithm (see link bellow). The algorithm is usefull for vegetation indexes filtering. It creates a curve that flows on upper boundary of the signal.
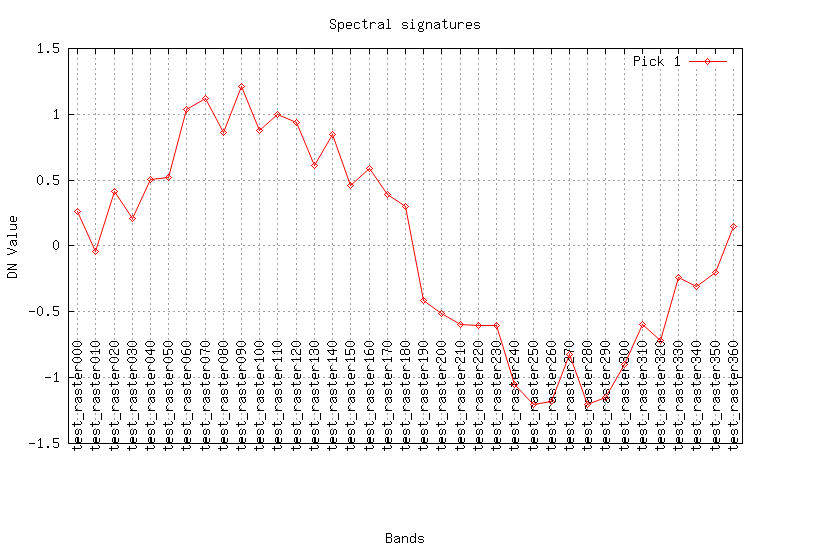
for T in $(seq -w 0 10 360)
do
  name="test_raster"$T
  r.mapcalc -s "$name = sin($T) + rand(-0.3, 0.3)"
done
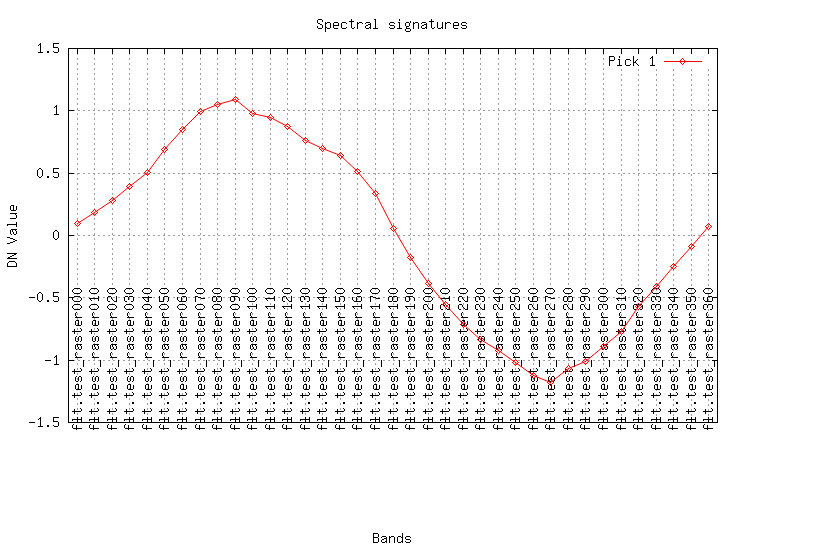
Create smooth raster series using Savitzky-Golay method:
maps=$(g.list rast patt="test_*" sep=,)
r.series.filter input=$maps result_prefix="flt." method=savgol winsize=9 order=2 --o
Look at the result (plot the curves for a pixel):
maps=$(g.list rast patt="test_*" sep=,)
fmaps=$(g.list rast patt="flt.*" sep=,)

eval $(g.region -cg)
i.spectral -g raster=$maps coor=$center_easting,$center_northing out=signal.png
i.spectral -g raster=$fmaps coor=$center_easting,$center_northing out=flt.png
Last changed: $Date$