Reads a raster map, writes to a vector map.
Doesn't check if output map already exists. (fixme)
The category given to the line refers to the row number. (starting with category 0!)
Nulls within a row are skipped, so holes will be filled by a straight line. (fixme) Nulls at the ends of lines are not included in the output line.
Nulls are not handled very well and may sneak through as very negative numbers. (fixme)
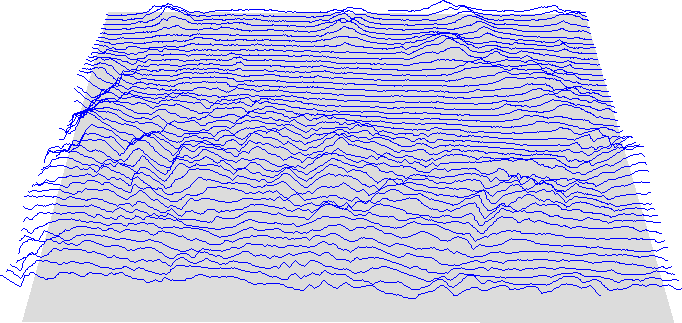
g.region raster=elevation.dem
r.to.vect.lines.py in=elevation.dem out=wiggle_lines
eval `v.info -g wiggle_lines`
r.mapcalc "floor = $bottom"
nviz elev=floor vector=wiggle_lines

# alternative
m.nviz.image elevation_map=floor vline=wiggle_lines resolution_fine=1 \
  zexag=20 out=wiggle.png perspective=5
Last changed: $Date$