DESCRIPTION

d.vect.chart displays charts for GRASS vector data in the active frame on the graphics monitor.

NOTES

The charts are positioned as follows: Bar charts are placed with their lower edge starting from the y-coordinate of the feature being symbolized, and centered with respect to the x-coordinate. The -c flag can be used to center the bar chart in both x and y directions.

The 'sizecol' parameter is proportionate to the radius.

The optional max_ref parameter accepts a list of values that represent the maximum value for each column listed in the values for the parameter columns. These values are used to create a framed bar plot if ctype is bar (See Example 2).

EXAMPLES

Example 1

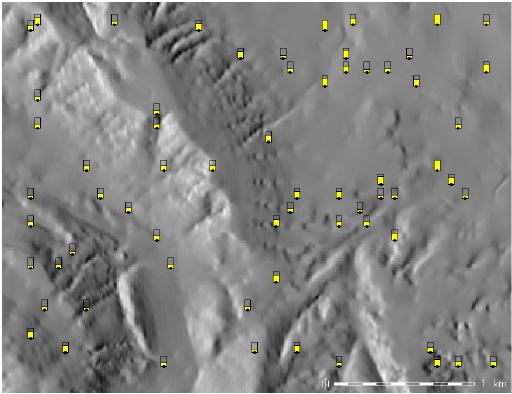
d.vect.chart map=vectmap columns=cens51,cens61,cens71,cens81

Example 2

Create framed bar graphs of an erodibiliy index from the SPEARFISH dataset.
r.to.vect -s -v in=erode.index out=erode_index feature=area 
v.extract in=erode_index out=erode_index_ctrds type=centroid 
d.rast aspect
d.vect.chart map=erode_index_ctrds ctype=bar columns=cat \
             size=10 max_ref=12 scale=1.5 colors=yellow 
d.vect erode_index_ctrds icon=basic/circle fcol=black col=black size=5
Example screenshot (zoomed):
d.vect.chart example

SEE ALSO

d.erase, d.vect, d.vect.thematic, d.what.vect, d.rast

AUTHOR

Radim Blazek, ITC-Irst, Trento, Italy

Last changed: $Date$