DESCRIPTION
i.spectral displays spectral response at user specified
locations in images.
It requires the user to either interactively select positions on the
Xmonitor (the default) or can function non-interactively with sampling
coordinates specified with the east_north option.
NOTES
This script needs gnuplot to be installed.
Output may be to a new graphics window on your monitor (the default), or
to an output file. Available output file formats are PNG, EPS, and SVG.
In interactive mode use the -m flag to select multiple sampling
points. Each coordinate pick will appear as a different colored line
graph.
EXAMPLES
Analysis of LANDSAT TM7 channels (North Carolina dataset):
g.region rast=lsat7_2002_10 -p
d.mon x0
d.rast lsat7_2002_40
i.spectral -i rast=lsat7_2002_10,lsat7_2002_20,lsat7_2002_30,lsat7_2002_40,lsat7_2002_50,lsat7_2002_70
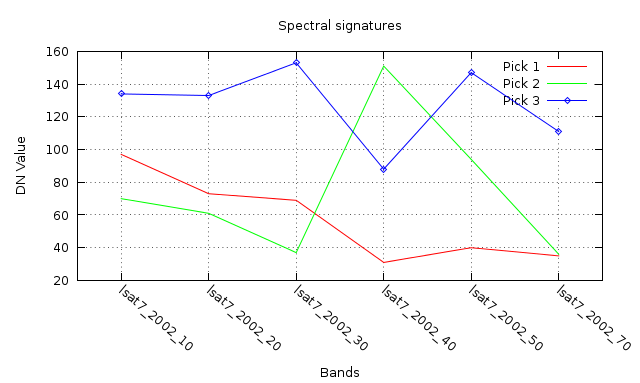
Spectral plot of 3 different land cover types: (1) water, (2) green
vegetation, and (3) highway
To analyze a time series of maps, use:
d.rast map_1
LIST=`g.mlist type=rast mapset=timeseries pat="map_*" | \
   sort -t '_' -k 2 -n | tr '\n' ','| sed 's+,$++g'`
i.spectral -i rast=$LIST
SEE ALSO
d.what.rast
d.where
r.what
AUTHOR
Markus Neteler
Francesco Pirotti
Hamish Bowman
Last changed: $Date$