The legend's default size is based on the dimensions of the active frame, specifically its height. d.legend will only obscure those portions of the active frame that directly underlie the legend.
Raster maps based on floating point values will display smoothed, from greatest to smallest value, while categorical raster maps will display in order, from top to bottom. Horizontal legends will always be smoothed. If the box is defined with inverted y-values or an inverted range, the legend will automatically flip. If this is not the desired result, the -f flag may be used to flip it back.
If the user attempts to display a very long legend in a relatively short display frame, the legend may appear in unreadably small text, or even revert to a smooth gradient legend. Use the lines, thin, use, range, and/or -n options to reduce the number of categories to be displayed, or the -s flag to force a smooth gradient legend.
The lines option will display the first number of categories, as defined by value, contained in the raster map. When used with the -n flag, it takes on a new meaning: "up to category #". When used with both thin and the -n flag, its meaning becomes more obscure. When using lines, auto-scaled text similar to "4 of 16 categories" will be placed at the bottom of the legend.
The thin option sets the thinning factor. For raster maps with a 0th category, thin=10 gives cats [0,10,20,...]. For raster maps starting at category 1, thin=10 gives cats [1,11,21,...].
The use option lets the user create a legend made up of arbitrary category values. e.g. use=1000,100,10,0,-10,-100,-1000
The range option lets the user define the minimum and maximum categories to be used in the legend. It may also be used to define the limits of a smooth gradient legend created from a raster containing floating point values. Note the color scale will remain faithful to the category values as defined with r.colors, and the range may be extended to the limits defined by the r.colors color map.
The flag -n is useful for categorial maps, as it suppresses the drawing of non-existing categories (otherwise the full range is shown).
Vertical legends produced with d.legend will place text labels to the right of the legend box, horizontal legends will place text below. This text will be auto-scaled to fit within the frame, reducing the size of the legend if necessary. Legends positioned with the at option will not auto-scale text, in order to provide more control to the user. Smaller text may be obtained in this case by reducing the height of the box or by using the fontsize option. The -c and -v flags may be used to suppress the display of category numbers and labels respectively, or used together to suppress all text of categorial raster maps.
The text produced from floating-point raster maps will automatically create output with a meaningful number of significant digits. For very small values, numbers will be expressed in scientific notation, e.g. "1.7e-9".
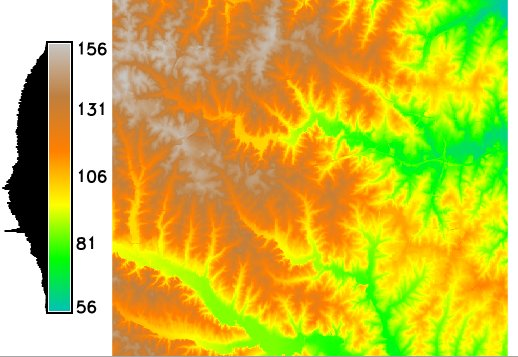
When the -d flag is used to display a histogram distribution along side the smoothed gradient legend, note that the statistics are calculated on the current computational region settings set by g.region. The default range however covers the entire natural bounds of the input map. If the histogram appears empty, check your region settings.
If the raster map's units metadata has been set with the r.support module then it will be displayed along side the legend.
g.region raster=elevation -p
d.rast elevation
d.legend -d elevation
Last changed: $Date$