DESCRIPTION
d.rast.num
overlays cell category values onto a raster map layer displayed
on the user's graphics monitor.
Category values will be displayed in the text color given and scaled
to fit within a single cell. A grid outlining each map cell will also
be overlain in a user-specified color, unless it has been set to "none".
If no grid color is given the default will be used. If no map layer
is specified, the program will use whatever raster map layer is
currently displayed in the active frame on the graphics monitor.
If the -f flag is given the displayed number will take on the color
of the base map in that cell.
NOTES
The user is advised to set the current region to a relatively
small area (i.e., less than 100 rows by 100 columns);
otherwise, the individual cells being displayed will be small
and the category value associated with each will be difficult to see.
No data cells are indicated with "Null".
EXAMPLE
A) Distance from the streams network (North Carolina sample dataset):
g.region raster=streams_derived -p
r.grow.distance input=streams_derived distance=dist_from_streams
d.rast.num dist_from_streams -a
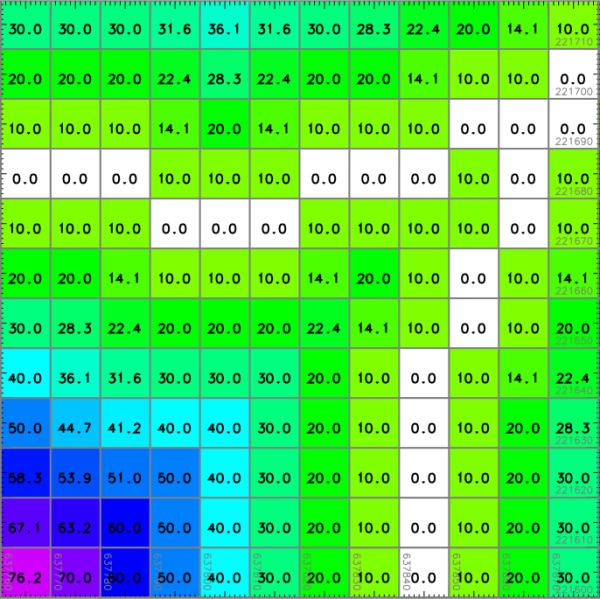 Euclidean distance from the streams network in meters (detail, numbers shown
with d.rast.num)
Euclidean distance from the streams network in meters (detail, numbers shown
with d.rast.num)
SEE ALSO
d.frame,
d.grid,
d.rast,
d.rast.arrow,
d.rast.edit,
g.region,
r.slope.aspect
AUTHORS
Raghavan Srinivasan,
and Chris Rewerts,
Agricultural Engineering, Purdue University
Last changed: $Date$