Thematic map of area sizes
Instead of a list of class breaks, the user can also chose a classification algorithm and a number of classes (nbclasses). See the v.class for more information on these different algorithms.
Important note: The module currently supports only area vector type. For displaying thematic choropleth vector maps of other types (points, lines) can be used d.vect.thematic2 available in AddOns via g.extension.
d.vect.thematic -l map=communes3 column=pop \
  breaks=111393.250000,222785.500000,334177.750000 \
  colors="255:0:0,0:255:0,0:0:255,0,0,0"
d.vect.thematic -l map=communes2 column=pop/area algorithm=std \
  nbclasses=5 colors="0:0:255,50:100:255,255:100:50,255:0:0,156:0:0"
# first save legend instructions to a file
d.vect.thematic -n map=communes2 column=pop/area algorithm=std \
  nbclasses=5 colors="0:0:255,50:100:255,255:100:50,255:0:0,156:0:0" \
  legendfile=legend_pop_dens

# open a monitor
d.mon wx0

# draw the map
d.vect.thematic map=communes2 column=pop/area algorithm=std \
  nbclasses=5 colors="0:0:255,50:100:255,255:100:50,255:0:0,156:0:0"

# draw the legend
d.graph input=legend_pop_dens
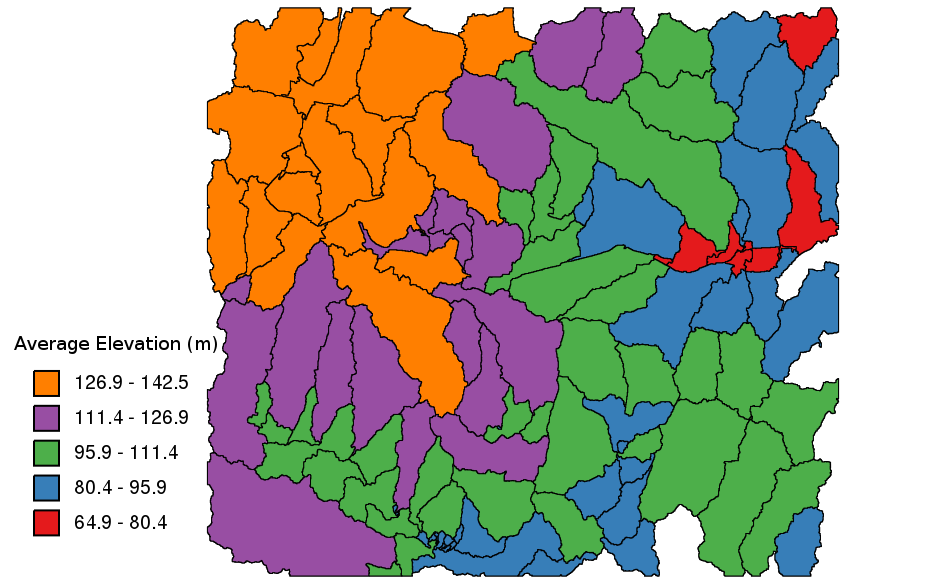
# create watersheds from elevation map
r.watershed elevation=elevation threshold=10000 basin=basins_10k

# convert raster to vector
r.to.vect input=basins_10k output=basins_10k type=area column=basin_num

# upload raster statistics to each polygon in vector map
v.rast.stats map=basins_10k raster=elevation column_prefix=elev_

# save legend instructions to a file
d.vect.thematic -n map=basins_10k column=elev_average algorithm=int \
  nclasses=5 colors=228:26:28,55:126:184,77:175:74,152:78:163,255:127:0 \
  legendfile=d_vect_thematic_leg.txt

# open a graphical display
d.mon wx0

# draw outline of polygons
d.vect map=basins_10k type=boundary

# draw color fill
d.vect.thematic map=basins_10k column=elev_average algorithm=int \
  nclasses=5 colors=228:26:28,55:126:184,77:175:74,152:78:163,255:127:0

# set a different font (list fonts with: d.font -l)
export GRASS_FONT="sans"

# and finally draw legend, but edit the legend file first (for example:
# set size to 20, remove feature counts and most decimal digits)
d.graph input=d_vect_thematic_leg.txt
Check also Python module from AddOns: d.vect.thematic2
Last changed: $Date$