The elevation input raster map specified by the user must contain true elevation values, not rescaled or categorized data. If the elevation values are in other units than in the horizontal units, they must be converted to horizontal units using the parameter zscale. In GRASS GIS 7, vertical units are not assumed to be meters any more. For example, if both your vertical and horizontal units are feet, parameter zscale must not be used.
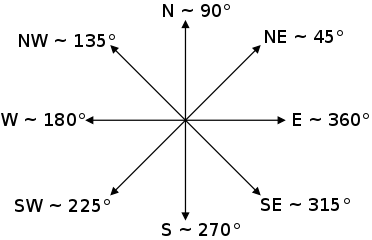
The aspect output raster map indicates the direction that slopes are
facing. The aspect categories represent the number degrees of east. Category
and color table files are also generated for the aspect raster map. The aspect
categories represent the number degrees of east and they increase
counterclockwise: 90 degrees is North, 180 is West, 270 is South 360 is East.
Note: These values can be transformed to azimuth (0 is North, 90 is East, etc)
values using r.mapcalc:
# convert angles from CCW to north up
r.mapcalc "azimuth_aspect = (450 - ccw_aspect) % 360"
The aspect is not defined for slope equal to zero. Thus, most cells with a very small slope end up having category 0, 45, ..., 360 in aspect output. It is possible to reduce the bias in these directions by filtering out the aspect in areas where the terrain is almost flat. A option min_slope can be used to specify the minimum slope for which aspect is computed. The aspect for all cells with slope < min_slope is set to null (no-data).
The slope output raster map contains slope values, stated in degrees of inclination from the horizontal if format=degrees option (the default) is chosen, and in percent rise if format=percent option is chosen. Category and color table files are generated.
Profile and tangential curvatures are the curvatures in the direction of steepest slope and in the direction of the contour tangent respectively. The curvatures are expressed as 1/metres, e.g. a curvature of 0.05 corresponds to a radius of curvature of 20m. Convex form values are positive and concave form values are negative.
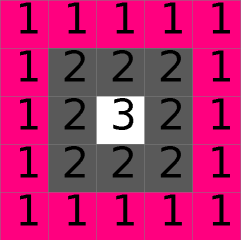
Example DEM
|
||
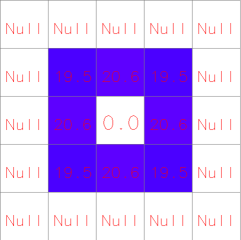
Slope (degree) from example DEM
|
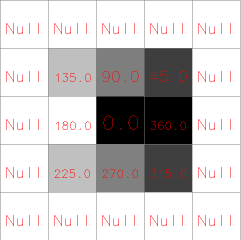
Aspect (degree) from example DEM
|
|
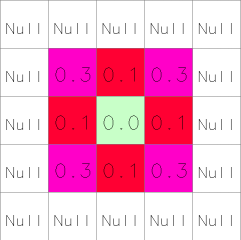
Tangential curvature (m-1) from example DEM
|
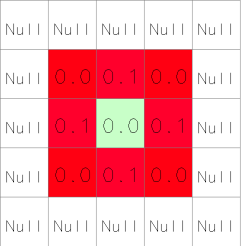
Profile curvature (m-1) from example DEM
|
For some applications, the user will wish to use a reclassified raster map of slope that groups slope values into ranges of slope. This can be done using r.reclass. An example of a useful reclassification is given below:
          category      range   category labels
                     (in degrees)    (in percent)

             1         0-  1             0-  2%
             2         2-  3             3-  5%
             3         4-  5             6- 10%
             4         6-  8            11- 15%
             5         9- 11            16- 20%
             6        12- 14            21- 25%
             7        15- 90            26% and higher

     The following color table works well with the above
     reclassification.

          category   red   green   blue

             0       179    179     179
             1         0    102       0
             2         0    153       0
             3       128    153       0
             4       204    179       0
             5       128     51      51
             6       255      0       0
7 0 0 0The current mask is ignored.
The algorithm used to determine slope and aspect uses a 3x3 neighborhood around each cell in the raster elevation map. Thus, it is not possible to determine slope and aspect for the cells adjacent to the edges in the elevation map layer. These cells are assigned a "zero slope" value (category 0) in both the slope and aspect raster maps.
Horn's formula is used to find the first order derivatives in x and y directions.
Only when using integer elevation models, the aspect is biased in 0, 45, 90, 180, 225, 270, 315, and 360 directions; i.e., the distribution of aspect categories is very uneven, with peaks at 0, 45,..., 360 categories. When working with floating point elevation models, no such aspect bias occurs.
g.region raster=elevation
r.slope.aspect elevation=elevation slope=slope aspect=aspect pcurvature=pcurv tcurvature=tcurv

# set nice color tables for output raster maps
r.colors -n map=slope color=sepia
r.colors map=aspect color=aspectcolr
r.colors map=pcurv color=curvature
r.colors map=tcurv color=curvature
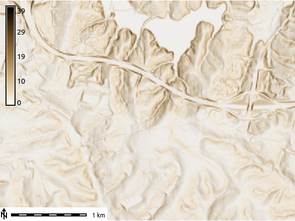
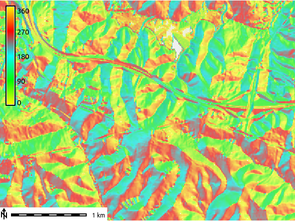
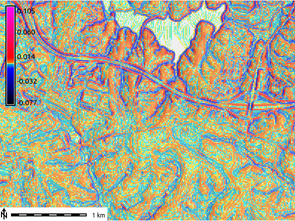
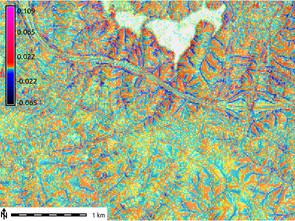
Figure: Slope, aspect, profile and tangential curvature raster map (North Carolina dataset)
g.region raster=elevation -p
# generate aspect map with CCW orientation
r.slope.aspect elevation=elevation aspect=myaspect
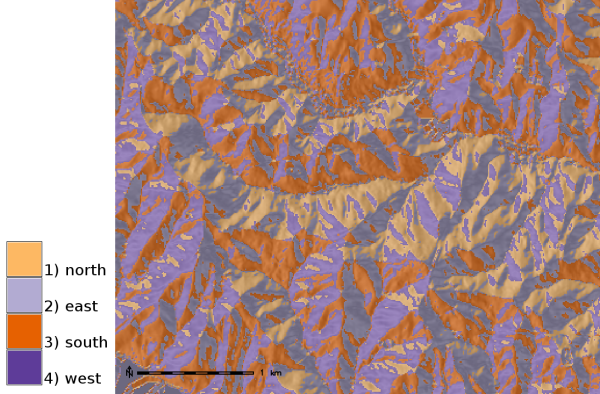
# generate compass orientation and classify four major directions (N, E, S, W)
r.mapcalc "aspect_4_directions = eval( \\
compass=(450 - myaspect ) % 360, \\
if(compass >=0. && compass < 45., 1) \\
+ if(compass >=45. && compass < 135., 2) \\
+ if(compass >=135. && compass < 225., 3) \\
+ if(compass >=225. && compass < 315., 4) \\
+ if(compass >=315., 1) \\
)"
# assign text labels
r.category aspect_4_directions separator=comma rules=- << EOF
1,north
2,east
3,south
4,west
EOF
# assign color table
r.colors aspect_4_directions rules=- << EOF
1 253,184,99
2 178,171,210
3 230,97,1
4 94,60,153
EOF
Last changed: $Date$