DESCRIPTION
d.correlate displays graphically the results of a
r.stats analysis run on two raster map layers. This module
highlights the correlation (or lack of it) among data
layers (scattergram).
The results are displayed in the active display frame on
the user's graphics monitor. d.correlate erases
the active frame before displaying results. If no graphics monitor
is open, a file map.png is generated in the current directory.
NOTES
If three or four map layers are specified, the correlation
among each combination of two data layers is displayed.
EXAMPLE
Scatterplot of two LANDSAT TM7 channels (North Carolina sample dataset):
g.region raster=lsat7_2002_30 -p
d.correlate map=lsat7_2002_30,lsat7_2002_40
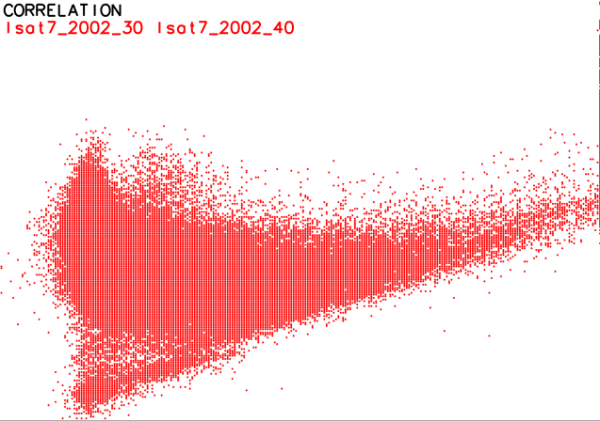
Scatterplot of two LANDSAT TM7 channels
SEE ALSO
d.text,
d.graph,
r.coin,
r.regression.line,
r.stats
AUTHORS
Michael Shapiro,
U.S.Army Construction Engineering Research Laboratory
Rewritten to GRASS 6 (from csh to sh) by Markus Neteler; from sh to Python by Glynn Clements
Last changed: $Date$