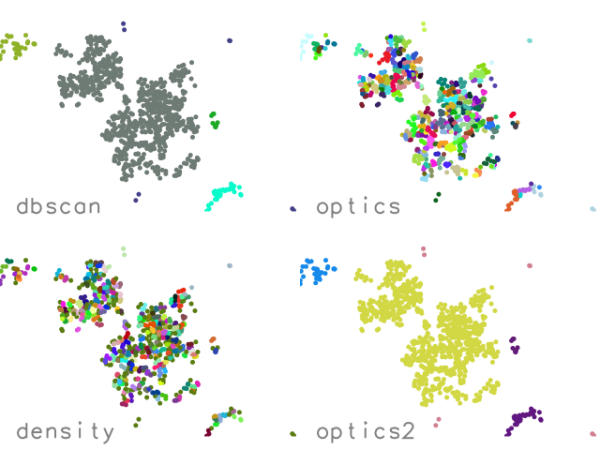
Figure: Four different methods with default settings applied to 1000 random points generated in the same way as in the example.
If the minimum number of points is not specified with the min option, the minimum number of points to constitute a cluster is number of dimensions + 1, i.e. 3 for 2D points and 4 for 3D points.
If the maximum distance is not specified with the distance option, the maximum distance is estimated from the observed distances to the neighbors using the upper 99% confidence interval.
v.cluster supports different methods for clustering. The recommended methods are method=dbscan if all clusters should have a density (maximum distance between points) not larger than distance or method=density if clusters should be created separately for each observed density (distance to the farthest neighbor).
The optics method does not create clusters itself, but produces an ordered list of the points together with their reachability. The output list is ordered according to the order of processing: the first point processed is the first in the list, the last point processed is the last in the list. Clusters can be extracted from this list by identifying valleys in the points' reachability, e.g. by using a threshold value. If a maximum distance is specified, this is used to identify clusters, otherwise each separated network will constitute a cluster.
The OPTICS algorithm uses each yet unprocessed point to start a new cluster. The order of the input points is arbitrary and can thus influence the resultant clusters.
First generate 1000 random points within the areas the vector urbanarea and within the subregion, then do clustering and visualize the result:
# pick a subregion of the vector urbanarea
g.region -p n=272950 s=188330 w=574720 e=703090 res=10

# create random points in areas
v.random output=random_points npoints=1000 restrict=urbanarea

# identify clusters
v.cluster input=random_points output=clusters_optics method=optics

# set random vector color table for the clusters
v.colors map=clusters_optics layer=2 use=cat color=random

# display in command line
d.mon wx0

# note the second layer and transparent (none) color of the circle border
d.vect map=clusters_optics layer=2 icon=basic/point size=10 color=none
Figure: Four different methods with default settings applied to 1000 random points generated in the same way as in the example.
# pick a subregion of the vector urbanarea
g.region -p n=272950 s=188330 w=574720 e=703090 res=10

# create clustered points
v.random output=rand_clust npoints=100 restrict=urbanarea -a

# identify clusters
v.cluster in=rand_clust out=rand_clusters method=dbscan

# create colors for clusters
v.db.addtable map=rand_clusters layer=2 columns="cat integer,grassrgb varchar(11)"
v.colors map=rand_clusters layer=2 use=cat color=random rgb_column=grassrgb

# display with your preferred method
# remember to use the second layer and RGB column
# for example use
d.vect map=rand_clusters layer=2 color=none rgb_column=grassrgb icon=basic/circle
Last changed: $Date$