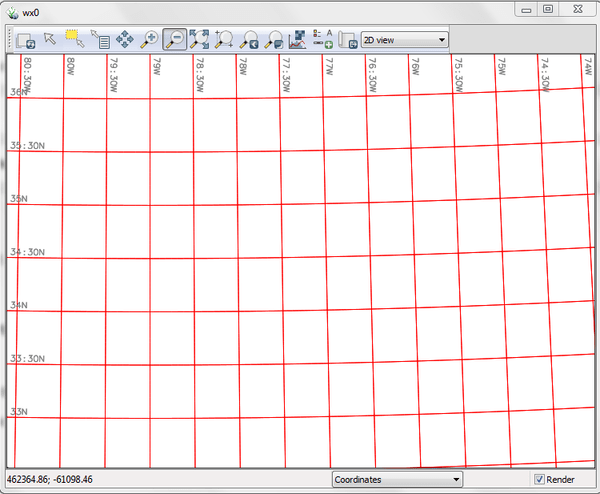
Figure: Showing a geographic grid in red line color
If the user provides a -g flag a geographic (projected) grid will be drawn. With the -g flag the size argument accepts both decimal degrees and colon separated ddd:mm:ss coordinates (eg. 00:30:00 for half of a degree). A geographic grid cannot be drawn for a latitude/longitude or XY projection.
Colors may be standard named GRASS colors (red, green, aqua, etc.) or a numerical R:G:B triplet, where component values range from 0-255. Grid color can be set with option color. Options text_color and bgcolor set the color of the text and its background.
The grid drawing may be turned off by using the -n flag.
The border drawing may be turned off by using the -b flag.
The coordinate text may be turned off by using the -t flag.
To draw grid lines at different intervals, e.g. at high latitudes, you can run the module twice, once with direction=east-west at one interval size, and again with direction=north-south at another interval size.
d.grid -g size=00:30:00 color=red
d.grid -g size=0.5 color=255:0:0
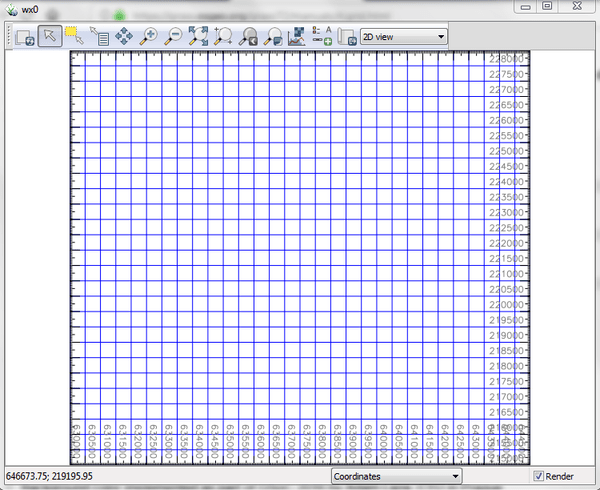
d.grid size=500 color=blue
Last changed: $Date$