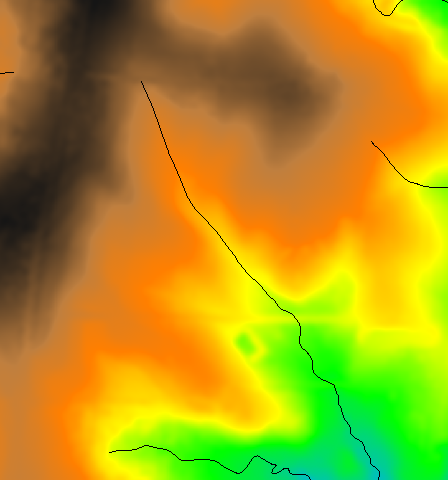
Fig: Original 1m LiDAR based DEM with vector streams map on top |
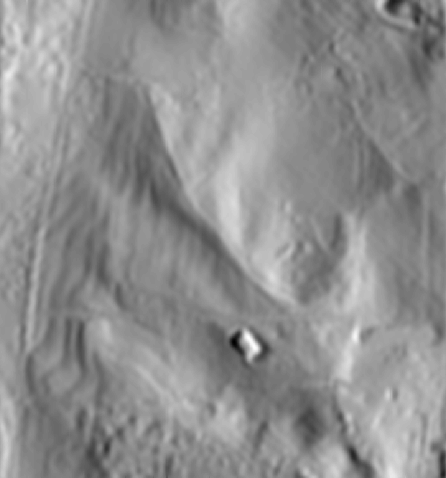
Fig: Original 1m LiDAR based DEM shown as shaded terrain |
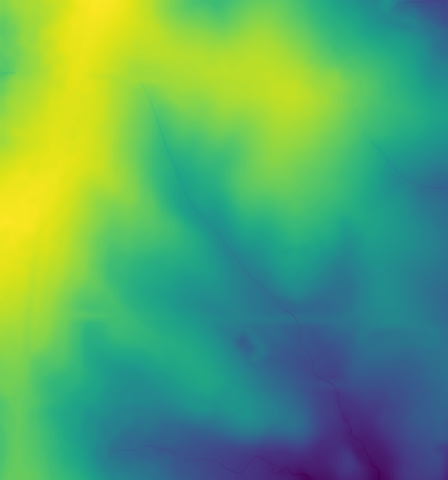
Fig: Carved 1m LiDAR based DEM |
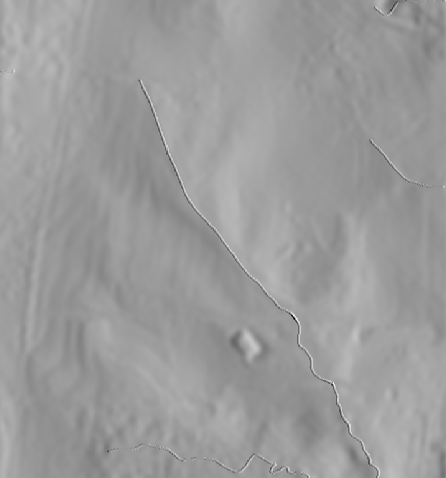
Fig: Carved 1m LiDAR based DEM shown as shaded terrain |
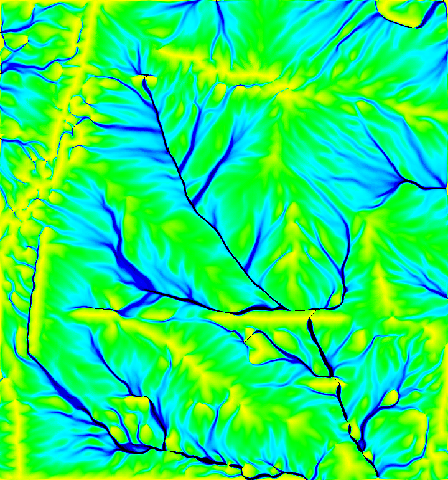
Fig: Flow accumulation in original 1m LiDAR based DEM |
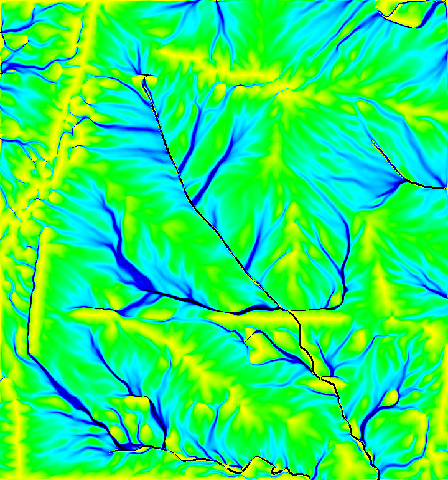
Fig: Flow accumulation in carved 1m LiDAR based DEM |