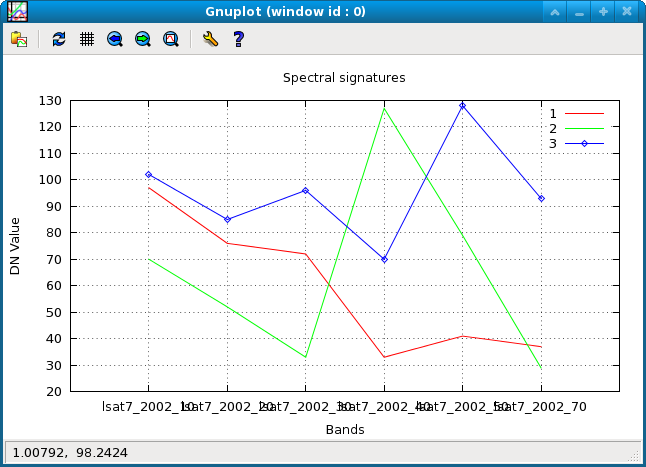
Spectral plot of 3 different land cover types: (1) water, (2) green vegetation, and (3) highway
g.region raster=lsat7_2002_10 -p
i.spectral -g input=lsat7_2002_10,lsat7_2002_20,lsat7_2002_30,lsat7_2002_40,lsat7_2002_50,lsat7_2002_70 \
           coordinates=636069,215440,637958,223393,633277,223605
North Carolina sample dataset:
g.region raster=lsat7_2002_10 -p
LIST=`g.list type=raster pattern="lsat7_2002_[1-5,7]0" separator=","`
i.spectral input=$LIST coordinates=637502.25,221744.25
Last changed: $Date$