Costs may be either line lengths, or attributes saved in a database
table. These attribute values are taken as costs of whole segments, not
as costs to traverse a length unit (e.g. meter) of the segment.
For example, if the speed limit is 100 km / h, the cost to traverse a
10 km long road segment must be calculated as
length / speed = 10 km / (100 km/h) = 0.1 h.
Supported are cost assignments for both arcs and nodes,
and also different costs for both directions of a vector line.
For areas, costs will be calculated along boundary lines.
The input vector needs to be prepared with v.net operation=connect in order to connect points representing center nodes to the network.
The nearest center can be determined using either costs from the nearest center or costs to the nearest center with option method.
By default, the iso band number is used as category value for output lines. With the -u flag, output lines become unique categories and an attribute table is created with the fields cat, ocat, center, isonr, isolbl. The ocat field holds the original line category in arc_layer, the center field holds the center category in node_layer, the isonr field holds the iso band number and the isolbl field holds a label for the isoband. Additionally, original line categories are copied from the input arc_layer to layer 2 in the output, together with any attribute table.
Application of flag -t enables a turntable support. This flag requires additional parameters turn_layer and turn_cat_layer that are otherwise ignored. The turntable allows to model e.g. traffic code, where some turns may be prohibited. This means that the input layer is expanded by turntable with costs of every possible turn on any possible node (intersection) in both directions. Turntable can be created by the v.net module. For more information about turns in the vector network analyses see wiki page.
Nodes must be on the isolines.
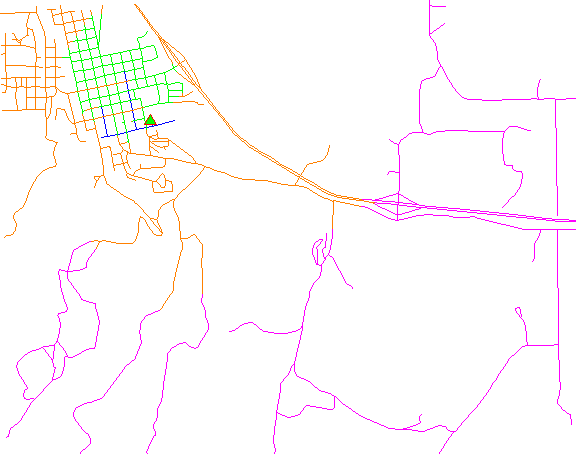
Isonetwork using distance:
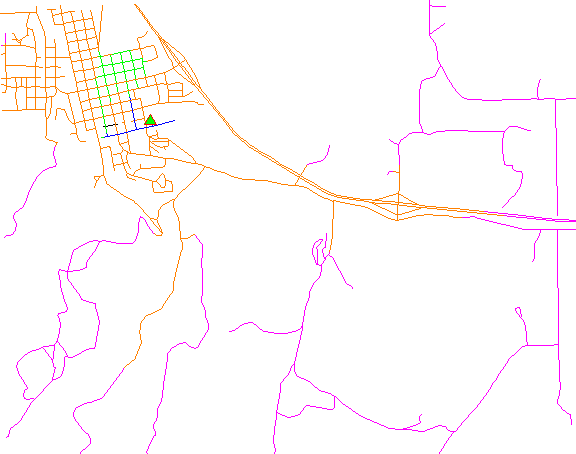
Isonetwork using time:
# Spearfish

# start node:
echo "591280.5|4926396.0|1" | v.in.ascii in=- out=startnode
g.copy vect=roads,myroads

# connect point to network
v.net myroads points=startnode out=myroads_net op=connect thresh=200

# define iso networks using distance:
v.net.iso input=myroads_net output=myroads_net_iso center_cats=1-100000 costs=1000,2000,5000
v.category myroads_net_iso option=report
# ... reports 4 categories:
#cat | distance from point in meters
#1          0 - < 1000
#2       1000 - < 2000
#3       2000 - < 5000
#4             >= 5000
g.region n=4928200 s=4922300 w=589200 e=596500
d.mon x0
d.vect myroads_net_iso col=blue   cats=1
d.vect myroads_net_iso col=green  cats=2
d.vect myroads_net_iso col=orange cats=3
d.vect myroads_net_iso col=magenta  cats=4
d.vect myroads_net col=red icon=basic/triangle fcol=green size=12 layer=2
# Spearfish

# start node:
echo "591280.5|4926396.0|1" | v.in.ascii in=- out=startnode
g.copy vect=roads,myroads

# connect point to network
v.net myroads points=startnode out=myroads_net op=connect thresh=200
# set up costs

# create unique categories for each road in layer 3
v.category in=myroads_net out=myroads_net_time opt=add cat=1 layer=3 type=line

# add new table for layer 3
v.db.addtable myroads_net_time layer=3 col="cat integer,label varchar(43),length double precision,speed double precision,cost double precision,bcost double precision"

# copy road type to layer 3
v.to.db myroads_net_time layer=3 qlayer=1 opt=query qcolumn=label columns=label

# upload road length in miles
v.to.db myroads_net_time layer=3 type=line option=length col=length unit=miles

# set speed limits in miles / hour
v.db.update myroads_net_time layer=3 col=speed val="5.0"
v.db.update myroads_net_time layer=3 col=speed val="75.0" where="label='interstate'"
v.db.update myroads_net_time layer=3 col=speed val="75.0" where="label='primary highway, hard surface'"
v.db.update myroads_net_time layer=3 col=speed val="50.0" where="label='secondary highway, hard surface'"
v.db.update myroads_net_time layer=3 col=speed val="25.0" where="label='light-duty road, improved surface'"
v.db.update myroads_net_time layer=3 col=speed val="5.0" where="label='unimproved road'"

# define traveling costs as traveling time in minutes:

# set forward costs
v.db.update myroads_net_time layer=3 col=cost val="length / speed * 60"
# set backward costs
v.db.update myroads_net_time layer=3 col=bcost val="length / speed * 60"

# define iso networks using traveling time:
v.net.iso input=myroads_net_time output=myroads_net_iso_time arc_layer=3 node_layer=2 arc_column=cost arc_backward_column=bcost center_cats=1-100000 costs=1,2,5
# add table with labels and coloring
v.db.addtable myroads_net_iso_time columns="cat integer,trav_time varchar(20),GRASSRGB varchar(11)"
# labels
v.db.update map=myroads_net_iso_time layer=1 column=trav_time value="0 - 1" where="cat = 1"
v.db.update map=myroads_net_iso_time layer=1 column=trav_time value="1 - 2" where="cat = 2"
v.db.update map=myroads_net_iso_time layer=1 column=trav_time value="2 - 5" where="cat = 3"
v.db.update map=myroads_net_iso_time layer=1 column=trav_time value="> 5" where="cat = 4"
# colors
# cats=1: blue
v.db.update map=myroads_net_iso_time layer=1 column=GRASSRGB value="000:000:255" where="cat = 1"
# cats=2: green
v.db.update map=myroads_net_iso_time layer=1 column=GRASSRGB value="000:255:000" where="cat = 2"
# cats=3: orange
v.db.update map=myroads_net_iso_time layer=1 column=GRASSRGB value="255:128:000" where="cat = 3"
# cats=4: magenta
v.db.update map=myroads_net_iso_time layer=1 column=GRASSRGB value="255:000:255" where="cat = 4"

# show results
g.region n=4928200 s=4922300 w=589200 e=596500
d.mon x0
d.vect myroads_net_iso_time layer=1 -a rgb_col=GRASSRGB
d.vect myroads_net col=red icon=basic/triangle fcol=green size=12 layer=2
Last changed: $Date$