DESCRIPTION
i.spectral displays spectral response at user specified
locations in images.
NOTES
This script needs gnuplot to be installed.
EXAMPLES
Analysis of LANDSAT TM7 channels (North Carolina dataset):
g.region rast=lsat7_2002_10 -p
d.mon x0
d.rast lsat7_2002_40
i.spectral -i rast=lsat7_2002_10,lsat7_2002_20,lsat7_2002_30,lsat7_2002_40,lsat7_2002_50,lsat7_2002_70
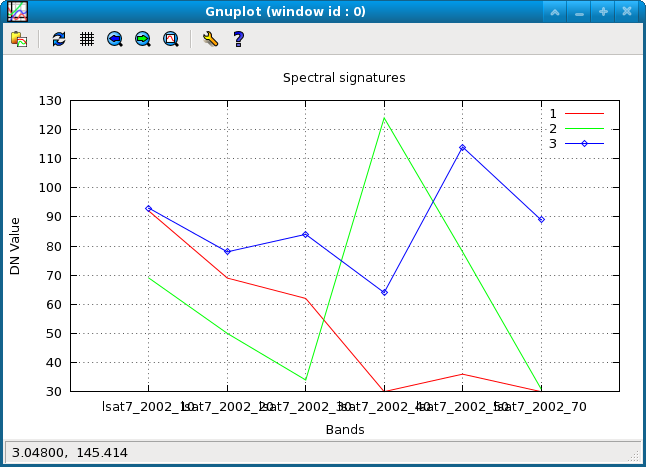
Spectral plot of 3 different land cover types: (1) water, (2) green vegetation, and (3) highway
To analyze a time series of maps, use:
d.rast map_1
LIST=`g.mlist type=rast mapset=timeseries pat="map_*" | sort -t '_' -k 2 -n | tr '\n' ','| sed 's+,$++g'`
i.spectral -i rast=$LIST
SEE ALSO
d.what.rast
d.where
r.what
AUTHOR
Markus Neteler
Francesco Pirotti
Last changed: $Date$