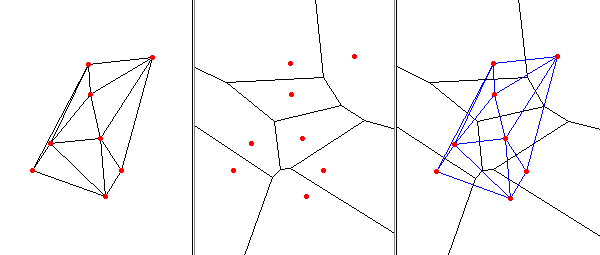
Delaunay triangulation and Voronoi diagram example:
  g.region n=4927250 s=4919400 w=588650 e=594850
  d.frame -c fr=one at=0,100,0,33.3333
  d.frame -c fr=two at=0,100,33.3333,66.6667
  d.frame -c fr=three at=0,100,66.6667,100

  v.delaunay -lr in=archsites out=arch_delaunay
  d.frame -s one
  d.vect arch_delaunay
  d.vect archsites color=red fcolor=red size=5 icon=basic/circle

  v.voronoi -l in=archsites out=arch_voronoi
  d.frame -s two
  d.vect arch_voronoi type=line
  d.vect archsites color=red fcolor=red size=5 icon=basic/circle

  d.frame -s three
  d.vect arch_voronoi type=line
  d.vect arch_delaunay color=blue
  d.vect archsites color=red fcolor=red size=5 icon=basic/circle
Last changed: $Date$