Thematic map of area sizes
Instead of a list of class breaks, the user can also chose a classification algorithm and a number of classes (nbclasses). See the v.class for more information on these different algorithms.
Important note: The module currently supports only area vector type. For displaying thematic choropleth vector maps of other types (points, lines) can be used d.vect.thematic2 available in AddOns via g.extension.
d.vect.thematic -l map=communes3 column=pop \
  breaks=111393.250000,222785.500000,334177.750000 \
  colors="255:0:0,0:255:0,0:0:255,0,0,0"
d.vect.thematic -l map=communes2 column=pop/area algorithm=std \
  nbclasses=5 colors="0:0:255,50:100:255,255:100:50,255:0:0,156:0:0"
# first save legend instructions to a file
d.vect.thematic -n map=communes2 column=pop/area algorithm=std \
  nbclasses=5 colors="0:0:255,50:100:255,255:100:50,255:0:0,156:0:0" \
  legendfile=legend_pop_dens

# open a monitor
d.mon wx0

# draw the map
d.vect.thematic map=communes2 column=pop/area algorithm=std \
  nbclasses=5 colors="0:0:255,50:100:255,255:100:50,255:0:0,156:0:0"

# draw the legend
d.graph input=legend_pop_dens
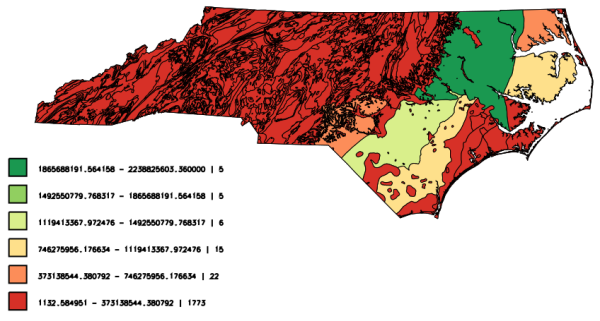
# first save legend instructions to a file
d.vect.thematic -n map=geology column=SHAPE_area algorithm=int nclasses=6 \
 colors=215:48:39,252:141:89,254:224:139,217:239:139,145:207:96,26:152:80 \
 legendfile=geology.leg

# open the graphical display
d.mon wx0
# draw outline of polygons
d.vect map=geology type=boundary
# draw color fill
d.vect.thematic map=geology column=SHAPE_area algorithm=int nclasses=6 \
 colors="215:48:39,252:141:89,254:224:139,217:239:139,145:207:96,26:152:80" \
# draw legend
d.graph input=geology.leg
Check also Python module from AddOns: d.vect.thematic2
Last changed: $Date$