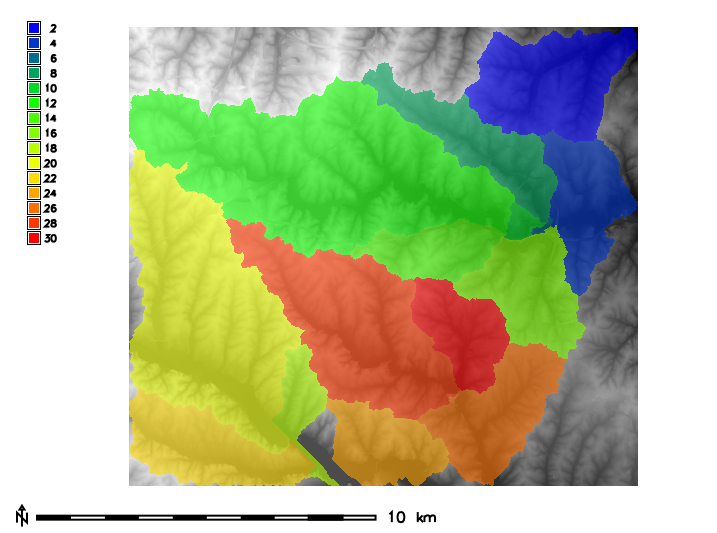
Figure: Zones (basins, opacity: 60%) with underlying elevation map for North Carolina sample dataset.
When multiple input maps are given to r.univar, the overall statistics are calculated. This is useful for a time series of the same variable, as well as for the case of a segmented/tiled dataset. Allowing multiple raster maps to be specified saves the user from using a temporary raster map for the result of r.series or r.patch.
This module can use large amounts of system memory when the -e extended statistics flag is used with a very large region setting. If the region is too large the module should exit gracefully with a memory allocation error. Basic statistics can be calculated using any size input region.
Without a zones input raster, the r.quantile module will be significantly more efficient for calculating percentiles with large maps.
For calculating univariate statistics from a raster map based on vector polygon map and uploads statistics to new attribute columns, see v.rast.stats.
g.region raster=basins -p
projection: 99 (Lambert Conformal Conic)
zone:       0
datum:      nad83
ellipsoid:  a=6378137 es=0.006694380022900787
north:      228500
south:      215000
west:       630000
east:       645000
nsres:      10
ewres:      10
rows:       1350
cols:       1500
cells:      2025000
r.category basins
2
4
6
8
10
12
14
16
18
20
22
24
26
28
30
d.mon wx0
d.rast map=elevation
r.colors map=elevation color=grey
d.rast map=basins
r.colors map=basins color=bgyr
d.legend raster=basins use=2,4,6,8,10,12,14,16,18,20,22,24,26,28,30
d.barscale
Figure: Zones (basins, opacity: 60%) with underlying elevation map for North Carolina sample dataset.
Then statistics for elevation can be calculated separately for every zone, i.e. basin found in the zones parameter:
r.univar -t map=elevation zones=basins separator=comma \
         output=basin_elev_zonal.csv
zone,label,non_null_cells,null_cells,min,max,range,mean,mean_of_abs,
stddev,variance,coeff_var,sum,sum_abs2,,116975,0,55.5787925720215,
133.147018432617,77.5682258605957,92.1196971445722,92.1196971445722,
15.1475301152556,229.447668592576,16.4433129773355,10775701.5734863,
10775701.57348634,,75480,0,61.7890930175781,110.348838806152,
48.5597457885742,83.7808205765268,83.7808205765268,11.6451777476995,
135.610164775515,13.8995747088232,6323776.33711624,6323776.33711624
6,,1137,0,66.9641571044922,83.2070922851562,16.2429351806641,
73.1900814395257,73.1900814395257,4.15733292896409,17.2834170822492,
5.68018623179036,83217.1225967407,83217.12259674078,,80506,
0,67.4670791625977,147.161514282227, ...
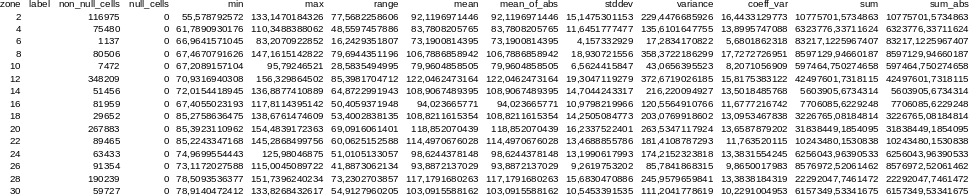
Figure: Raster statistics for zones (basins, North Carolina sample dataset) viewed through Libre/Open Office Calc
Last changed: $Date$