DESCRIPTION
d.geodesic displays a geodesic line in the active frame on the user's
graphics monitor. This is also known as the great circle line and traces the
shortest distance between two user-specified points on the curved surface of
a longitude/latitude data set. The two coordinate locations named must fall
within the boundaries of the user's current geographic region.
OPTIONS
By default black line color and red text color will be used.
By indicating the starting and ending coordinates
of the geodesic, the line and its length (by default in meters) are displayed to
the graphical output. If the text color is set to none,
the great circle distance is not displayed.
EXAMPLE
A geodesic line if shown over the political map of the world
(demolocation dataset):
g.region vector=country_boundaries -p
d.mon wx0
d.vect country_boundaries type=area
# show additionally a 20 degree grid
d.grid 20

d.geodesic coordinates=55:58W,33:18S,26:43E,60:37N \
  line_color=yellow text_color=red units=kilometers
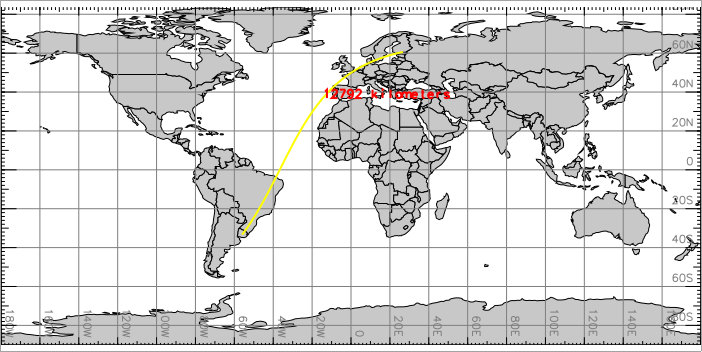
Geodesic line (great circle line)
NOTES
This program works only in GRASS locations with longitude/latitude
coordinate system.
SEE ALSO
d.rhumbline,
d.grid,
m.measure
AUTHOR
Michael Shapiro, U.S. Army Construction Engineering Research Laboratory
Last changed: $Date$