DESCRIPTION
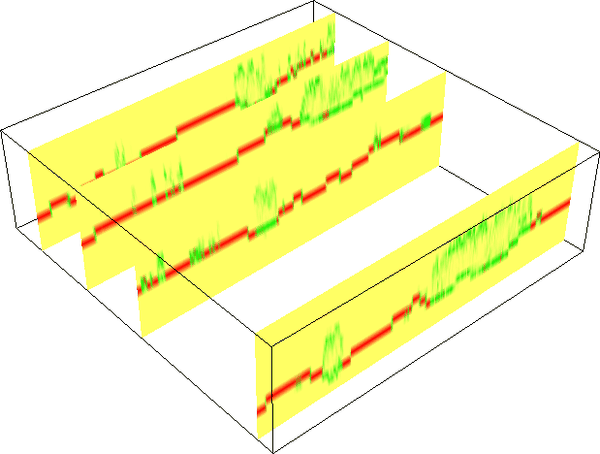
Figure: Proportional count of points per 3D cell. When 50% of all
points in a vertical column fall into a given 3D cell, the value
is 0.5. Here, the green color was assigned to 0.5, red to 1 and
yellow to 0. The figure shows vertical slices and green color
indicates high vegetation while red color indicates bare ground.
NOTES
-
This module is highly experimental. Don't rely on its
functionality or interface. Please report issues on the mailing
list or in the bug tracker.
-
No projection check or reprojection is performed, make sure you
are using data in the right projection for your GRASS Location.
-
Selection of points according to return or class is not yet
supported.
- All outputs are currently mandatory.
- Some temporary maps are created but not cleaned up.
-
Expects points to have intensity (random result for related
outputs when they don't).
EXAMPLES
Set the region according to a 2D raster and adding 3D minimum
(bottom), maximum (top) and vertical (top-bottom) resolution.
g.region rast=secref b=80 t=160 tbres=5 -p3
r3.in.lidar input=points.las n=points_n sum=points_sum \
    mean=points_mean proportional_n=points_n_prop \
    proportional_sum=points_sum_prop
Point density vertical structure reduced to the terrain
Create ground raster:
r.in.lidar input=points.las output=ground method=mean class_filter=2
g.region rast=secref b=0 t=47 -p3
r3.in.lidar input=points.las n=points_n sum=points_sum \
    mean=points_mean proportional_n=points_n_prop \
    proportional_sum=points_sum_prop \
    base_raster=ground
SEE ALSO
r3.in.xyz,
r.in.lidar,
v.in.lidar,
r.to.rast3,
r3.mapcalc,
g.region
REFERENCES
AUTHOR
Vaclav Petras, NCSU GeoForAll Lab
Last changed: $Date$