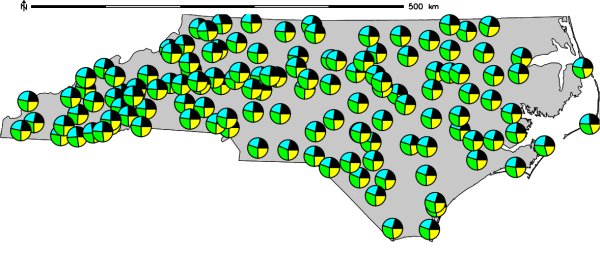
2D pie-chart of monthly winter precipitation in North Carolina
The 'sizecol' parameter is proportionate to the radius.
The optional max_ref parameter accepts a list of values that represent the maximum value for each column listed in the values for the parameter columns. These values are used to create a framed bar plot if chart_type is bar (See Example 2).
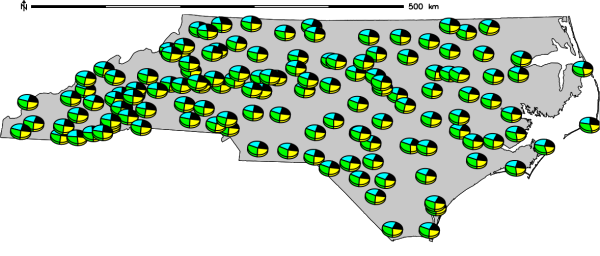
g.region vector=nc_state -p
d.vect nc_state
d.vect.chart precip_30ynormals chart_type=pie columns=nov,dec,jan,feb -l

# show pie chart as 3D
d.erase
d.vect nc_state
d.vect.chart precip_30ynormals chart_type=pie columns=nov,dec,jan,feb -l -3
d.vect.chart map=vectmap columns=cens51,cens61,cens71,cens81 chart_type=bar
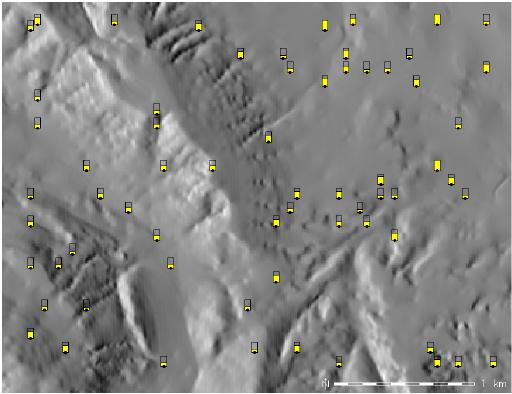
g.region raster=erode.index -p
r.to.vect -s input=erode.index output=erode_index type=area
v.extract input=erode_index output=erode_index_ctrds type=centroid
d.rast aspect
d.vect.chart map=erode_index_ctrds chart_type=bar columns=cat \
             size=10 max_ref=12 scale=0.05 colors=yellow
d.vect erode_index_ctrds icon=basic/circle fcol=black col=black size=5
Last changed: $Date$