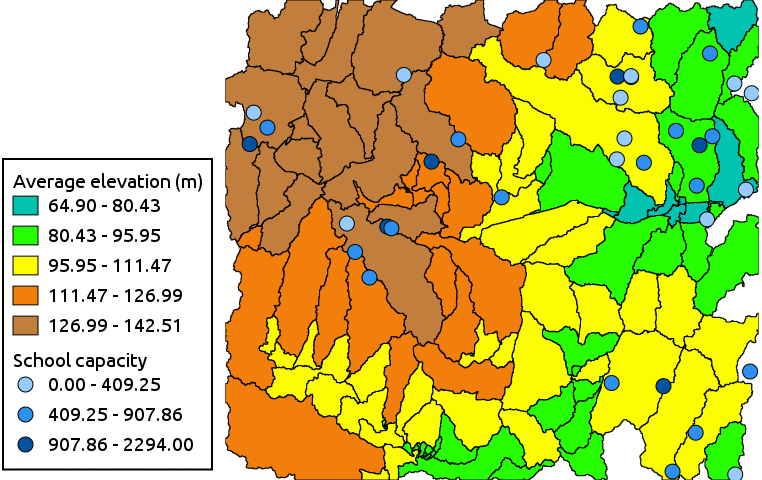
Thematic map of average elevation and school capacity
Instead of a list of class breaks, the user can also chose a classification algorithm and a number of classes (nbclasses). See the v.class for more information on these different algorithms.
Option legendfile, is deprecated, instead use the GRASS_LEGEND_FILE environmental variable (see d.legend.vect) to save legend into a file. Flag -e is deprecated, instead use verbose flag.
d.vect.thematic -l map=communes3 column=pop \
  breaks=111393.250000,222785.500000,334177.750000 \
  colors="255:0:0,0:255:0,0:0:255,0,0,0"
d.vect.thematic -l map=communes2 column=pop/area algorithm=std \
  nbclasses=5 colors="0:0:255,50:100:255,255:100:50,255:0:0,156:0:0"
# create watersheds from elevation map
g.region raster=elevation
r.watershed elevation=elevation threshold=10000 basin=basins_10k

# convert raster to vector
r.to.vect input=basins_10k output=basins_10k type=area column=basin_num

# upload raster statistics to each polygon in vector map
v.rast.stats map=basins_10k raster=elevation column_prefix=elev

# open a graphical display
d.mon wx0

# draw thematic polygons and specify legend title
d.vect.thematic map=basins_10k column=elev_average algorithm=int \
  nclasses=5 colors=0:195:176,39:255:0,251:253:0,242:127:11,193:126:60 \
  legend_title="Average elevation (m)"

# draw thematic points and specify legend title
d.vect.thematic map=schools_wake@PERMANENT column=CORECAPACI algorithm=std \
  nclasses=3 colors=149:203:255,45:143:240,0:81:161 icon=basic/circle size=15 \
  legend_title="School capacity"

# and finally draw legend
d.legend.vect -b at=2,80 font=Sans symbol_size=25
Check also Python module from AddOns: d.vect.thematic2
Last changed: $Date$