DESCRIPTION
v.vect.stats counts the number of points in vector map
points falling into each area in vector map areas.
Optionally statistics on point attributes in points are
calculated for each area. The results are either uploaded to the
attribute table of the vector map areas or printed to stdout.
Statistical Methods:
Using numeric attribute values of all points falling into a given area,
a new value is detmined with the selected method.
v.vect.stats can perform the following operations:
- sum
- The sum of values.
- average
- The average value of all point attributes (sum / count).
- median
- The value found half-way through a list of the
attribute values, when these are ranged in numerical order.
- mode
- The most frequently occurring value.
- minimum
- The minimum observed value.
- min_cat
- The point category corresponding to the minimum observed value.
- maximum
- The maximum observed value.
- max_cat
- The point category corresponding to the maximum observed value.
- range
- The range of the observed values.
- stddev
- The statistical standard deviation of the attribute values.
- variance
- The statistical variance of the attribute values.
- diversity
- The number of different attribute values.
NOTES
Points not falling into any area are ignored. Areas without category
(no centroid attached or centroid without category) are ignored.
If no points are falling into a given area, the point count is set to 0
(zero) and the statistics result to "null".
The columns count_column and stats_column are created if not
existing. If they do already exist, the count_column must be of
type integer and the stats_column of type double precision.
EXAMPLES
Preparation for examples
The subsequent examples are based on randomly sampled
elevation data (North Carolina sample database):
# work on map copy for attribute editing
g.copy vector=zipcodes_wake,myzipcodes_wake

# set computational region: extent of ZIP code map, raster pixels
# aligned to raster map
g.region vector=myzipcodes_wake align=elev_state_500m -p
#  generate random elevation points
r.random elev_state_500m vector=rand5000 n=5000
v.colors rand5000 color=elevation

# visualization
d.mon wx0
d.vect myzipcodes_wake -c
d.vect rand5000
Count points per polygon with printed output
See above for the creation of the input maps.
Counting points per polygon, print results to terminal:
v.vect.stats points=rand5000 area=myzipcodes_wake -p
Count points per polygon with column update
See above for the creation of the input maps.
Counting of points per polygon, with update of "num_points" column
(will be automatically created):
v.vect.stats points=rand5000 area=myzipcodes_wake count_column=num_points
# verify result
v.db.select myzipcodes_wake column=ZIPCODE_,ZIPNAME,num_points
Average values of points in polygon with printed output
See above for the creation of the input maps.
Calculation of average point elevation per ZIP code
polygon, printed to terminal in comma separated style:
# check name of point map column:
v.info -c rand5000
v.vect.stats points=rand5000 area=myzipcodes_wake \
  method=average points_column=value separator=comma -p
Average values of points in polygon with column update
See above for the creation of the input maps.
Calculation of average point elevation per ZIP code polygon,
with update of "avg_elev" column and counting of points per polygon,
with update of "num_points" column (new columns will be automatically
created):
# check name of point map column:
v.info -c rand5000
v.vect.stats points=rand5000 area=myzipcodes_wake count_column=num_points \
  method=average points_column=value stats_column=avg_elev
# verify result
v.db.select myzipcodes_wake column=ZIPCODE_,ZIPNAME,avg_elev
Point statistics in a hexagonal grid
The grid extent and size is influenced by the current computational
region. The extent is based on the vector map
points_of_interest from the basic North Carolina sample dataset.
g.region vector=points_of_interest res=2000 -pa
v.vect.stats points=points_of_interest areas=hexagons method=average \
  points_column=elev_m count_column=count stats_column=average
v.colors map=hexagons use=attr column=average color=viridis
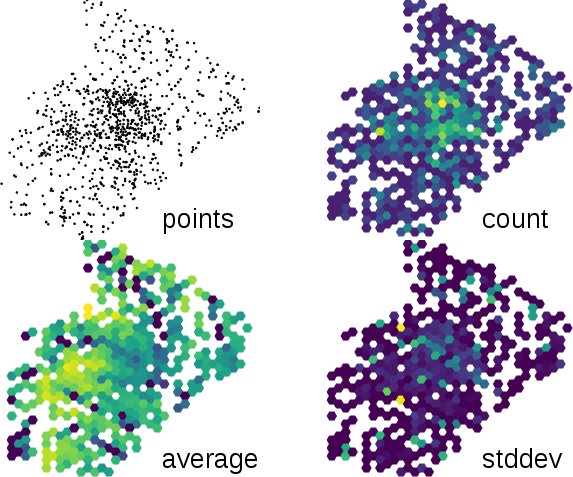
Point statistics in a hexagonal grid (count of points, average of values
associated with point, standard deviation)
SEE ALSO
v.distance,
r.distance,
v.rast.stats,
v.what.vect,
v.mkgrid
AUTHOR
Markus Metz
Last changed: $Date$