Gutenkarte is a geographic text browser, intended to help readers explore the spatial component of classic works of literature. It is built atop MetaCarta's GeoParser API, and uses OpenLayers to display locations on a general map and on the 'browse' pages.
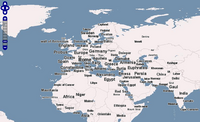
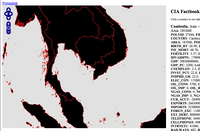
The World Free Map is a queryable version of the CIA Factbook. Clicking on a country will show information about it, from the population to the number of cell phones.
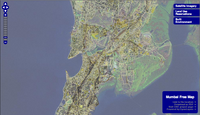
The Mumbai Free Map is an attempt to create an open-data base mapping initiative in Mumbai, India. It is part of the Free Map System, and contains raster and vector data to an incredibly detailed level. OpenLayers replaced MapBuilder as the primary mapping interface for the project in May of 2006.
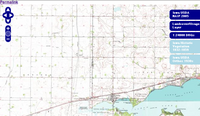
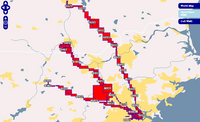
The Boston Free Map uses data from MassGIS inside of an OpenLayers instance. It is designed to be used by applications in Massachusetts which are dedicated to free/open data, such as the Open Guide to Boston.

GSMLoc.org is a cell stumbling site. It uses OpenLayers to power the maps which are the basis of displaying information to users on the site.
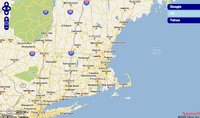
One of the most impressive aspects of OpenLayers is its ability to interact with the data from the other data providers. The Multiple Provider Demo shows how OpenLayers can be used as the frontend to the proprietary data providers as well as public data sources.
Display the MIT IMS server data in OpenLayers
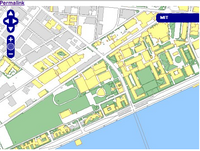
Display 5 different layers: Landcover 2002, 1:24000 DRGs, 1832-1859 Vegetation/Landcover, 1930s orthos, and 2005 orthos