DESCRIPTION
Note: wxNviz is currently under development. Not
all functionality is implemented.
wxNviz is a wxGUI 3D view
mode which allows users to realistically render multiple
surfaces (raster data) in a 3D space, optionally using
thematic coloring, draping 2D vector data over the surfaces,
displaying 3D vector data in the space, and visualization
of volume data (3D raster data).
To start the wxGUI 3D view mode, choose '3D view' from the map
toolbar.
wxNviz is emphasized on the ease and speed of viewer positioning and
provided flexibility for using a wide range of data. A low resolution
surface or wire grid (optional) provides real-time viewer positioning
capabilities. Coarse and fine resolution controls allow the user to
further refine drawing speed and detail as needed. Continuous scaling
of elevation provides the ability to use various data types for the
vertical dimension.
For each session of wxNviz, you might want the same set of 2D/3D
raster and vector data, view parameters, or other attributes. For
consistency between sessions, you can store this information in the
GRASS workspace file (gxw). Workspace contains information to
restore "state" of the system in 2D and if wxNviz is enabled also in
the 3D display mode.
3D View Toolbar
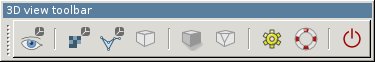
 Switch to view page
- Switch 3D Layer Manager Toolbox's page to the view
control page.
 Switch to surface page
- Switch 3D Layer Manager Toolbox's page to the surface
control page (data properties).
 Switch to vector page
- Switch 3D Layer Manager Toolbox's page to the vector
control page (data properties).
 Switch to volume page
- Switch 3D Layer Manager Toolbox's page to the volume
control page (data properties).
 Switch to light page
- Switch 3D Layer Manager Toolbox's page to the light
control page (appearance).
 Switch to fringe page
- Switch 3D Layer Manager Toolbox's page to the fringe
control page (appearance).
 Show 3D view mode settings
- Show dialog with settings for wxGUI 3D view mode. The user
settings can be stored in wxGUI settings file.
 Show help
- Show this help.
 Quit
Quit- Quit 3D view mode and switch map display to the 2D view
mode.
3D View Layer Manager Toolbox
The 3D view toolbox is integrated in the Layer Manager. The toolbox
has several tabs:
- View for view controling,
- Data for data properties,
- Appearance for appearance settings (lighting, fringes, ...).
View
You can use this panel to set the position, direction, and
perspective of the view. The position box shows a puck with a
direction line pointing to the center. The direction line indicates
the look direction (azimuth). You click and drag the puck to change
the current eye position. The box annotations are North, South,
East, and West. You can also set exact position using Look
at choice control.
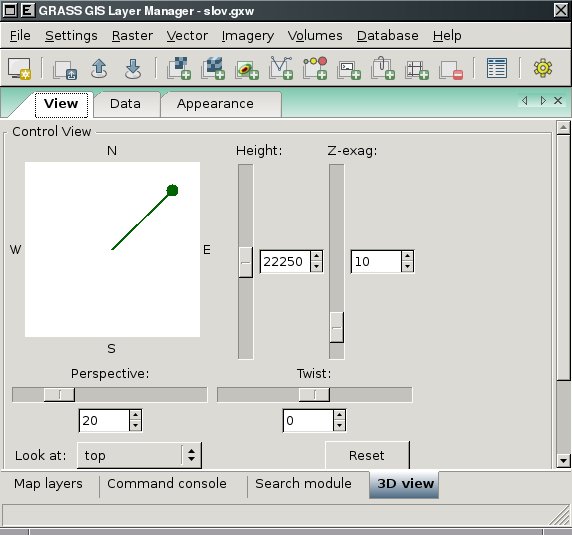
You can adjust the viewer's height above the scene, angle of view or
twist value to rotate the scene about the horizontal axis. An angle of
0 is flat. The scene rotates between -90 and 90 degrees.
You can also adjusts the vertical exaggeration of the surface. As an
example, if the easting and northing are in meters and the elevation
in feet, a vertical exaggeration of 0.305 would produce a true
(unexaggerated) surface.
Reset returns all current settings to their default values.
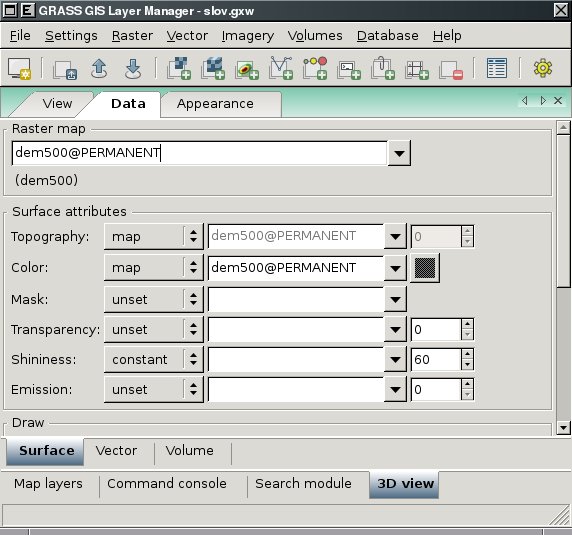
Data properties - Surface
Each active raster map layer from the current layer tree is displayed
as surface in the 3D space. Separate raster data or constants can be
used for various attributes of the surface:
- topography - raster map or constant values used as elevation (z
values) for the current surface.
- color - raster map or constant color to drape over the current
surface. This option is useful for draping imagery such as aerial
photography over a DEM.
- mask - raster map that controls the areas displayed from
the current surface.
- transparency - raster map or constant value that controls
the transparency of the current surface. The default is completely
opaque. Range from 0 (opaque) to 255 (transparent).
- shininess - raster map or constant value that controls
the shininess (reflectivity) of the current surface. Range from 0 to
255.
- emission - raster map or constant value that controls the
light emitted from the current surface. Range from 0 to 255.
This panel controls how loaded surfaces are drawn. The top half of the
panel has options to set, unset or modify attributes of the current
surface. The bottom half has drawing style options, masking or
changing surface position in the space.
Surface can be drawn as a wire mesh or using filled polygons (most
realistic). You can set draw mode to coarse (fast
display mode), fine (draws surface as filled polygons with
fine resolution) or both (which combines coarse and fine
mode). Additionally set coarse style to wire to draw
the surface as wire mesh (you can also choose color of the wire)
or surface to draw the surface using coarse resolution filled
polygons. This is a low resolution version of the polygon surface
style.
E.g. surface is drawn as a wire mesh if you set mode
to coarse and style to wire. Note that it
differs from the mesh drawn in fast display mode because hidden lines
are not drawn. To draw the surface using filled polygons, but with
wire mesh draped over it, choose mode both
and style wire.
Beside mode and style you can also choose style of shading used
for the surface. Gouraud style draws the surfaces with a
smooth shading to blend individual cell colors together, flat
draws the surfaces with flat shading with one color for every two
cells. The surface appears faceted.
To set given draw settings for all loaded surfaces press button "All".
Data properties - Vector
2D vector data can be draped on the selected surfaces with various
markers to represent point data; you can use attribute of vector
features to determine size, color, shape of glyph.
3D vector data including volumes (closed group of faces with one
kernel inside) is also supported.
This panel controls how loaded 2D or 3D vector data are drawn.
You can define the width (in pixels) of the line features, the color
used for lines or point markers.
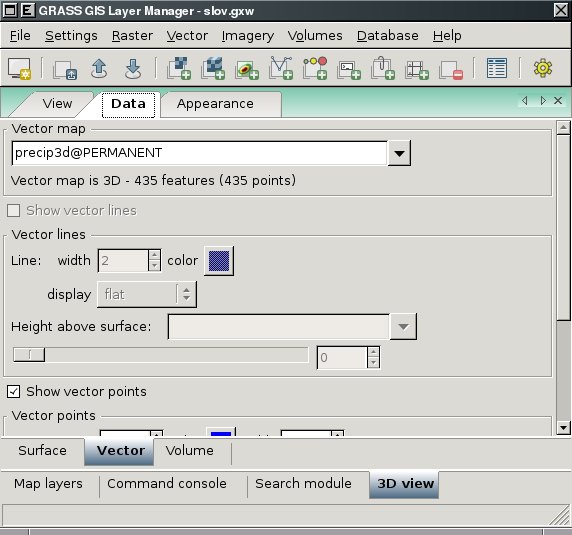
If vector map is 2D you can display vector features as flat at a
specified elevation or drape it over a surface(s) at a specified
height. Use the height control to set the flat elevation or the drape
height above the surface(s).
For display purposes, it is better to set the height slightly above
the surface. If the height is set at zero, portions of the vector may
disappear into the surface(s).
For 2D/3D vector points you can also set the size of the markers and
the width (in pixels) of the line used to draw the point markers (only
applies to wire-frame markers). Currently are implemented these
markers:
- x sets the current points markers to a 2D "X",
- sphere - solid 3D sphere,
- diamond - solid 3D diamond,
- cube - solid 3D cube,
- box - hollow 3D cube,
- gyroscope - hollow 3D sphere,
- asterisk - 3D line-star.
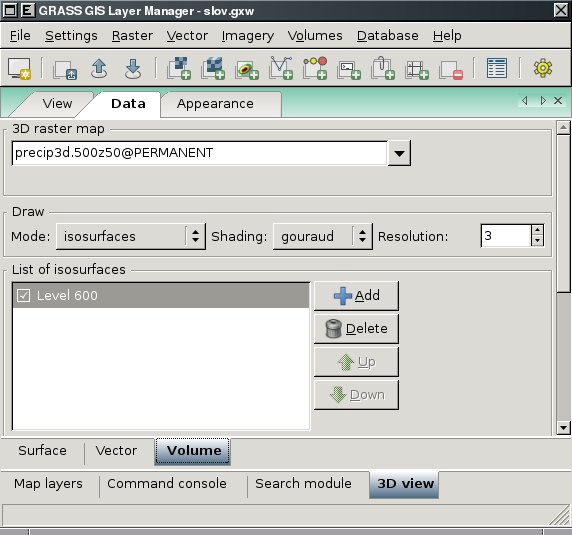
Data properties - Volume
Volumes can be displayed either as isosurfaces or slices. Various
attributes of the isosurface can be defined, similarly to surface
attributes:
- level - reference isosurface level (height in map
units).
- color - raster map or constant color to drape over the
current volume.
- mask - raster map that controls the areas displayed from
the current volume.
- transparency - raster map or constant value that controls
the transparency of the current volume. The default is completely
opaque. Range from 0 (opaque) to 255 (transparent).
- shininess - raster map or constant value that controls
the shininess (reflectivity) of the current volume. Range from 0 to
255.
- emission - raster map or constant value that controls the
light emitted from the current volume. Range from 0 to 255.
This panel controls how loaded volumes are drawn. Volume can be drawn
in two different modes: isosurface or slice. The top
part of the panel has drawing style options. The middle part has
controls to add, delete, move up/down selected isosurface or
slices. The bottom part has options to set, unset or modify attributes
of the current isosurface or slice.
Similarly to surface panel you can define draw shading
- gouraud (draws the volumes with a smooth shading to blend
individual cell colors together) and flat (draws the volumes
with flat shading with one color for every two cells. The volume
appears faceted). As mentioned above currently are supported two
visualization modes:
- isosurface - the levels of values for drawing the
volume(s) as isosurfaces,
- and slice - the levels of values for drawing the volume
as cross-sections.
Settings
This panel has controls which allows user to set default surface,
vector and volume data attributes. You can also modify default view
parameters, or to set the background color of the Map Display Window
(the default color is white).
To be implement
- Improve intuitive navigation (mouse, fly mode)
- Animation capabilities
- Arbitrary cutting planes
- Labels, decoration, etc.
- Scripting capabilities
- Better workspace support (view settings, lighting)
- Surface - mask by zero/elevation, more interactive positioning
- Vector points - implement display mode flat/surface for 2D points
- Volume - slice draw mode
- ...
Please note that wxNviz is under active development and
distributed as "Experimental Prototype".
SEE ALSO
See also wiki page.
Command-line module nviz_cmd.
Original TCL/TK-based Nviz.
AUTHORS
Martin
Landa, Google
Summer of Code 2008 (mentor: Michael Barton)
and Google
Summer of Code 2010 (mentor: Helena Mitasova)
$Date$