DESCRIPTION
wxGUI is a new generation of the GUI for GRASS GIS. It's a successor
of the Tcl/Tk GUI from GRASS 6.
If wxGUI is not your default GUI, you can define it as default by
typing at GRASS command line prompt
or define in your .grassrc6 file 'GRASS_GUI' variable
The GUI can be quit by selecting the 'File->Exit' menu item. The GUI
can be restarted from the GRASS command line prompt by typing
or to restart with previously saved workspace type:
g.gui wxpython workspace=file.gxw
You can also start GRASS from the shell command line with wxGUI
defined by the -wxpython switch:
The GUI is composed by two main components:
- The Layer Manager includes map layer management, integrated
command-line prompt, and command output window tab.
- The Map Display Window integrates basic tools for
zooming, panning, data querying, and map elements (north arrows,
barscale, etc.). Each display window is associated with its own
set of map layers in the layer manager. The user may start multiple map
displays during a session. The map layers for each display are grouped
under different tabs in the Layer Manager.
wxGUI comes with more icon themes, for detailed information
see this page.
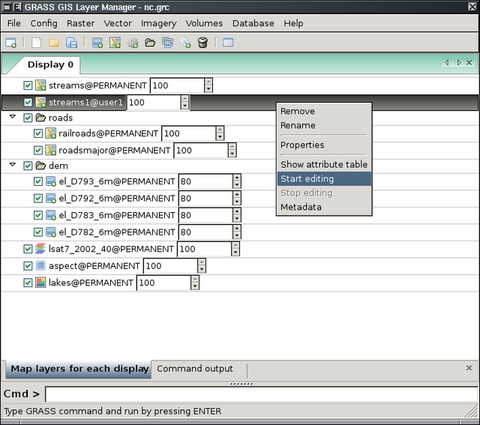
Layer Manager
The Layer Manager provides an interactive graphical interface for
creating and managing GRASS displays. There is a toolbar to manage displayed
map layers, a layer tree frame in which map layers for display are organized,
a command output window tab, and interactive command line prompt. On Linux
and Windows platforms, the layer manager also has a menu bar with a set of
pull-down menus for all GRASS GIS functions (analysis, file I/O, GIS
configuration and management); on a Mac, the GRASS functions menu is at the
top of the screen.
The top left button of the toolbar opens a new Map Display
Window. Each map display has a unique set of layers to display
and region settings. Other toolbar buttons add layers of different
types for display in the selected map display window. There are
additional buttons for saving or opening workspace file, and others.
Map layers are listed in the window frame below the toolbar. Layers can
include raster and vector maps, vector labels, and commands (where any
GRASS command can be written). Layers are displayed as arranged in the layer
tree: the bottom layer is displayed first and the top layer is displayed
last, as if the layers were a series of stacked overlays.
The check box to the left of each layer makes it active or inactive
for display. Only active layers are displayed/redisplayed when the
display button is pressed. Layers can be organized into groups; entire
groups can be activated or deactivated for display. Layer tree
composition can be saved to a workspace file and opened in subsequent
sessions, restoring all layers and their display options.
A right mouse click on a layer or left clicking the button to the right of
the layer opens a dropdown menu with options to remove or rename the layer
(g.remove, g.rename), change its display properties (d.rast and d.vect
options such as color, symbol, etc.), show its metadata (r.info, v.info) or
attributes, if applicable.
A left mouse double click on a layer opens GUI for its display options
These options are those for the d.* command for each layer type (d.rast,
d.vect, or d.grid, for example).
Layer Manager Toolbar
 Open new Map Display Window
- Opens a new map display and creates empty layer tree tab in Layer Manager.
 Create new workspace file
- Removes all layers in the layer tree and creates a new, empty tree
where new layers can be added.
 Load map layers (raster, vector) into workspace
- Loads selected raster or vector maps into current layer tree.
 Open an existing workspace file
- Opens an previously saved workspace file, containing a set of display
layers and their option settings.
 Save workspace file
- Saves current set of layers and their options to a workspace
file.
 Add raster map layer
- Adds raster map to layer tree, see d.rast.
 Add various raster-based map layers
- Opens a dropdown menu that allows user to select to:
-
Add shaded relief raster map layer
- Adds shaded relief raster map layer,
see d.shadedmap
 Add RGB raster layer
- Combines and displays three raster maps defined as red, green,
and blue channels to create an RGB color map,
see d.rgb.
 Add HIS raster layer
- Combines and displays two or three raster maps defined as hue,
intensity, and (optionally) saturation channels to create a color map,
see d.his.
 Add raster arrows layer
- Adds map of raster cells with directional arrows drawn. Arrow
direction and length are determined by separate aspect/directional map
and (optional) slope/intensity map,
see d.rast.arrow.
-
Add raster numbers layer
- Adds map of raster cells with numbers representing the cell values,
see d.rast.num.
 Add vector map layer
- Adds a vector map layer, see d.vect.
 Add various vector-based map layers
 - Opens a dropdown menu that allows user to select to:
-
Add thematic map layer
(for all vector types)
- Adds layer for thematic display values from a numeric attribute
column associated with a vector map. Options include: thematic display
type (graduated colors or point sizes), methods for creating display
intervals, SQL query of attribute column to limit vector objects to
display, control of point icon types and sizes, control of thematic
color schemes, creation of legend for thematic map, and saving the
results of thematic mapping to a ps.map instructions file for later
printing,
see d.vect.thematic.
 Add thematic charts layer (for vector points)
- Adds layer in which pie or bar charts can be automatically created
at vector point locations. Charts display values from selected columns
in the associated attribute table. Options include: chart type, layer
and attributes to chart, chart colors, and chart size (fixed or based
on attribute column),
see d.vect.chart.
 Add command layer
- Adds a layer in which a GRASS GIS command or command list can be entered.
For a command list use the semi-colon (";") symbol as a separator.
For example:
d.rast soils;d.rast -o roads;d.vect streams col=blue
d.text text=Population\ density
 Add layer group
- Adds an empty layer group. Layers can then be added to the group.
 Add grid or vector labels overlay
- Opens a dropdown menu that allows user to select to:
-
Add overlay grids and lines
- Adds layer to display regular grid (for all locations)
see d.grid
 Add labels layer for vector objects (from existing labels file)
- Add a layer of text from a labels file for vector objects
created with the v.label module.
A labels file can also be created with a text editor,
see d.labels.
 Add geodesic line layer
- Add layer to display geodesic line for latitude/longitude locations only,
see d.geodesic
-
Add rhumbline layer
- Add layer to display rhumblines (for latitude/longitude locations only),
see d.rhumbline.
 Delete selected layer
- Removes selected map layer or map layer group from layer tree.
 Show Attribute Table Manager for selected vector map
- Displays attribute data of selected vector map.
Key shortcuts
Menu
- Ctrl+N
- Create new workspace
- Ctrl+O
- Load workspace from file
- Ctrl+S
- Close workspace
- Ctrl+L
- Load map layers
- Ctrl+W
- Exit GUI
- Ctrl+Q
- Quit GRASS
Global
- Ctrl+Tab
- Switch 'Map layers' and 'Command output' tab
- Ctrl+R
- Add raster map layer
- Ctrl+V
- Add vector map layer
Command line prompt
- Tab
- Show command tooltips
- Esc
- Hide command tooltips
- Ctrl+Space
- Map entries without arguments (as in r.info [mapname])
- Up/Down
- List command history
- Enter
- Run command
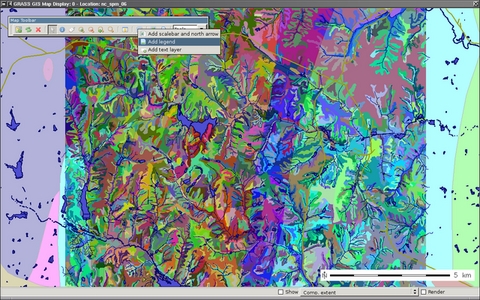
Map Display Window
The map display window includes toolbar that can be docked and undocked from
the window, a map canvas where a map composition of one or more layers is
displayed, and a statusbar with information about the geographic region of
the maps displayed.
Each Map Display Window has a unique layer tree (in the layer manager)
and geographic region setting. At the top of the window is a
toolbar with buttons to manage the map in the display (render, erase, zoom
and pan), for query and and analysis (distance measurement, profile,
and histogram creation), to overlay map elements onto the display (scale,
north arrow, legend, and custom text), and to export or print the display.
In the statusbar, the user can choose to display the geographic coordinates
under the cursor, current geographical region extent, computational region
(including graphical visualization in map display), map display geometry
(number of rows, columns, resolution) and map scale. Checking the
render button in the statusbar will cause the map display to update
automatically any time a map is added to, removed from, or changed in its
layer tree.
It is important to note that zooming in any display will
have no effect on the 'computational region' setting (set
with g.region). Only by selecting
the 'Set current region to match display' item in the zoom menu (in
the map display toolbar) will the current display extents be copied to
the computational region extents.
Map Display Toolbar
 Display map
- Displays all active layers from layer tree and re-renders for display
any layers that have changed since the last time the display was updated,
including layers added or removed.
 Re-render map
- Re-renders all active layers regardless of whether they have changed
or not.
 Erase display
- Erases the currently selected map display to a white background.
see d.erase, d.frame
-e.
 Pointer
- Select arrow cursor for map display.
 Query raster/vector maps
- Opens a dropdown menu that allows user to select to:
- Query selected raster, RGB raster (all three map channels will be
queried), or vector map(s) using the mouse. Map(s) must be selected
before query. Vector charts and thematic vector maps cannot be
queried. The results of the query will be displayed in the console window,
see r.what, v.what.
- Query selected vector map in edit mode. The results of the query
will be displayed in a form that permits editing of the queried vector
attributes.
 Pan
Pan- Interactive selection of a new center of view in the active
display monitor. Drag the pan cursor while pressing the left mouse
button to pan. Panning changes the location of the region displayed
but not the size of the area displayed or the resolution. Panning
does not affect the computational region for other GIS
processes, see g.region.
 Zoom in
- Interactive zooming with the mouse in the active display monitor.
Drawing a box or just click with the mouse (left button) and zoom-in
cursor causes the display to zoom in so that the area defined by the
box fills the display. The map resolution is not changed. Clicking
with the zoom-in cursor causes the display to zoom in by 30%, centered
on the point where the mouse is clicked. Zooming resets the display
region extents (both size and location of area displayed). It
does not affect the computational region for other GIS
processes, see g.region.
 Zoom out
- Interactive zooming with the mouse in the active display monitor.
Drawing a box or just click with the mouse (left button) and zoom-out
cursor causes the display to zoom in so that the area displayed
shrinks to fill the area defined by the box. The map resolution is not
changed. Clicking with the zoom-out cursor causes the display to zoom
out by 30%, centered on the point where the mouse is clicked. Zooming
resets the display region extents (both size and location of area
displayed). It does not affect the computational region for
other GIS processes,
see g.region.
 Return to previous zoom
- Returns to the previous zoom extent. Up to 10 levels of zoom back are
maintained, see g.region.
 Zoom options
- Opens a dropdown menu that allows user to:
- Zoom to match the extents of a selected map
- Zoom to match the computational region (set with g.region)
- Zoom to match the extents of the default region
- Zoom to match the extents of a saved region
- Set computational region (the mapset's WIND file) to match the
current display extents (does not change the resolution),
see g.region.
Save display geometry (current extents) to a named region file
 Analyze menu
Opens a dropdown menu with:
Analyze menu
Opens a dropdown menu with:
-
 Distance measurement tool
- Interactive measurement of lengths defined with the mouse. The
length of each segment and the cumulative length of all segments
measuered is displayed in the command output window frame. Lengths are
measured in the current measurement unit,
see d.measure.
 Profile tool
- Interactively create profile of a raster map. Profile transect is
drawn with the mouse in map display. The profile may be of the
displayed map or a different map. Up to three maps can be profiled
simultaneously,
see Profile Tool help page.
 Histogram tool
- Displays histogram of selected raster map or image in new window,
see d.histogram.
 Add overlay
opens a dropdown menu that allows user to:
Add overlay
opens a dropdown menu that allows user to:
-
 Add scalebar and north arrow
- Adds layer to display a combined scalebar and north arrow. Options
include scalebar placement (using screen coordinates or a mouse),
scalebar format, and scalebar colors,
see d.barscale.
 Add raster map legend
- Adds layer to display with legend of selected raster map,
see d.legend.
 Add text layer
- Adds layer to display a line of text using default GRASS font
(selected with d.font). Options
include: text placement (screen coordinates); and text size, bolding,
and color, see d.text.
 Save display to graphic file
Save the visible image in map display to different raster graphic formats.
Save display to graphic file
Save the visible image in map display to different raster graphic formats.
 Print map
Prints map on system native printer or PostScript device;
saves visible map display (including PostScript text and labels) to PDF
or EPS file.
Print map
Prints map on system native printer or PostScript device;
saves visible map display (including PostScript text and labels) to PDF
or EPS file.
Map display mode
Opens a dropdown menu for selecting different display mode
- 2D view mode
- Normal GIS display. All active layers are composited and displayed
in 2D mode.
- 3D view mode
- Experimental replacement for NVIZ. Displays all active layers in
3D perspective using OpenGL. A new control panel opens to manage the
3D view. 3D view can be zoomed, panned, rotated, and tilted. The
vertical exaggeration of rasters and 3D vectors can be set. Various
color and lighten settings are possible. Not yet functional for
Windows platforms
- Digitize mode
- Puts display into vector digitizing mode and opens a new digitizing
toolbar. The user can digitize a new map or edit an existing
map. Not yet functional for Windows platforms
SEE ALSO
Vector Digitizer
Attribute Table Manager
3D Viewer
Graphical Modeler
Manage Ground Control Points
Icon themes
See also wiki page.
TCL/TK-based GIS Manager,
TCL/TK-based Display Manager
AUTHORS
Martin Landa, FBK-irst, Trento, Italy, and CTU in Prague, Czech Republic
Michael Barton, Arizona State University, USA
Daniel Calvelo Aros,
Jachym Cepicky
$Date$